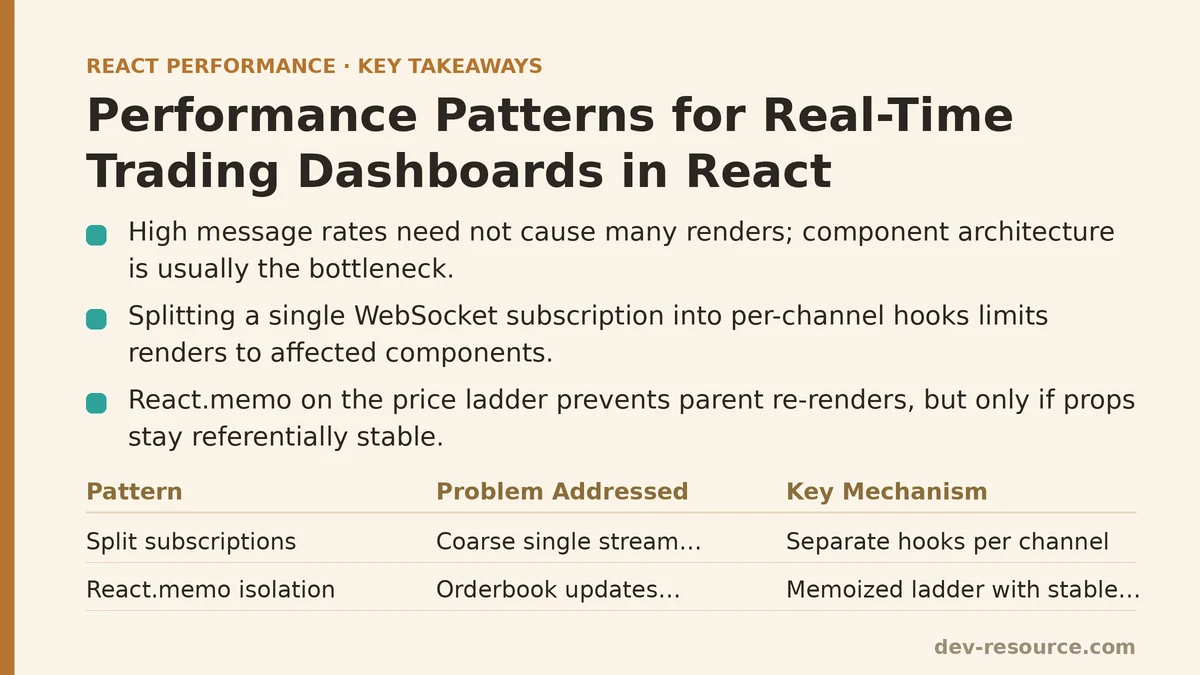
The confusion most teams run into is between how much data you receive and how often your React tree renders. A WebSocket delivering 2,000 messages per second does not have to cause 2,000 renders per second — and if it does, the problem is your component architecture, not your network throughput. This post walks through a single trading dashboard rebuild, from a janky, unusable interface to one that holds a steady 60fps during high-volatility market events.
The Starting Point: One Subscription, One Giant Render Loop
The original dashboard was a single React component wrapping a custom hook that subscribed to a WebSocket. Every update message — regardless of which instrument it belonged to — was pushed into a single state object at the root of the component tree. The component tree had three main sections: a price ladder (order book), a candlestick chart, and a list of open positions.
The code looked something like this:
// A naive approach: one subscription, one state object, one giant re-render
function useMarketData(symbols) {
  const [marketData, setMarketData] = useState({});

  useEffect(() => {
    const ws = new WebSocket('wss://api.example.com/stream');

    ws.onmessage = (event) => {
      const message = JSON.parse(event.data);
      setMarketData(prev => ({
        ...prev,
        [message.symbol]: {
          ...prev[message.symbol],
          [message.type]: message.payload
        }
      }));
    };

    return () => ws.close();
  }, [symbols]);

  return marketData;
}
Every single price tick, every order book depth change, every position update — all of it flowed through that single setMarketData call. React would re-render the entire tree: the price ladder, the chart’s underlying data array, the positions table, and every memoized child that depended on any of it.
During a simulated 500-message-per-second burst (not unusual for a volatile symbol during an earnings announcement), the dashboard dropped to 12 frames per second. The React DevTools Profiler showed the root component re-rendering 500 times per second, each render taking roughly 80 milliseconds. The browser was spending more time reconciling the tree than it was painting anything useful.
The diagnosis: the subscription was too coarse, and the state distribution was too wide. The fix required addressing both problems separately.
Pattern One: Split the Subscription Streams
The first structural change was to stop treating all market data as a single undifferentiated stream. The WebSocket protocol in use (FIX-like, but adapted for JSON) already tagged messages with a channel field: quote, orderbook, trade, and position. The problem was that the client flattened all of these into one state bucket.
The fix was to create separate subscription hooks, each filtering to a specific channel:
function useChannelSubscription(channel, symbols) {
  const [data, setData] = useState(null);
  const subscriptionRef = useRef(null);

  useEffect(() => {
    const ws = new WebSocket('wss://api.example.com/stream');

    ws.onopen = () => {
      ws.send(JSON.stringify({ action: 'subscribe', channel, symbols }));
    };

    ws.onmessage = (event) => {
      const message = JSON.parse(event.data);
      // The server echoes the channel back on every message
      if (message.channel === channel) {
        setData(message.payload);
      }
    };

    return () => ws.close();
  }, [channel, symbols]);

  return data;
}
This is deceptively simple, but it changes the rendering characteristics of the entire app. A quote update for AAPL no longer causes the order book for TSLA to re-render, because the order book component is subscribed to the orderbook channel, and the quote update never touches that component’s state.
The trade-off: you now maintain multiple WebSocket connections (or at least multiple message filters). In practice, one connection with a filter function per hook is simpler to reason about; the key is that each hook’s setData call triggers renders only in components that consume that hook’s output.
Pattern Two: Isolate High-Frequency Updates Behind React.memo
Splitting the subscriptions reduced render frequency dramatically, but the orderbook channel itself was still updating 20–30 times per second during volatile periods. The price ladder component rendering 30 times per second is fine — until each render also re-renders its siblings.
The fix here was two-fold: wrap the price ladder in React.memo to prevent parent re-renders from cascading, and ensure the props being passed to it are referentially stable.
Here is the critical failure mode: if you pass an inline object literal to a memoized component, the memo is defeated, because the parent’s render creates a new object reference every time.
// WRONG: inline object literal defeats React.memo
<PriceLadder data={{ bids: orderBook.bids, asks: orderBook.asks }} />
// RIGHT: stable reference via useMemo
const ladderData = useMemo(
  () => ({ bids: orderBook.bids, asks: orderBook.asks }),
  [orderBook.bids, orderBook.asks]
);

<PriceLadder data={ladderData} />
The useMemo call only recreates ladderData when the underlying arrays change. If the order book updates 30 times per second, ladderData updates 30 times per second — that’s necessary and expected. But if the parent component re-renders for an unrelated reason (say, a positions update), ladderData stays referentially the same, and React.memo skips the re-render entirely.
The verification step: after adding React.memo and useMemo, the Profiler showed PriceLadder re-rendering only when its own data changed, rather than on every parent render. Render count can fall from hundreds per second to roughly a few dozen per second — often a reduction of well over 90%.
Pattern Three: Defer Non-Critical Updates to requestIdleCallback
Even with subscriptions split and memoization in place, there was one remaining category of updates that did not need to happen synchronously: historical trade list entries and position PnL calculations. These are informational, not interactive. If a trade entry renders 200 milliseconds late, nobody notices. If the order book renders 200 milliseconds late while a trader is trying to click a price level, that is a problem.
The solution for the low-priority updates was to batch them into requestIdleCallback, which lets the browser decide when to run the update based on available idle time. React 18’s useDeferredValue hook provides similar semantics without managing the callback manually.
function useDeferredMarketData(channel, symbols) {
  const rawData = useChannelSubscription(channel, symbols);
  const deferredData = useDeferredValue(rawData);
  return deferredData;
}
useDeferredValue tells React: this value is lower priority. If urgent updates (like order book ticks) are happening, the deferred value’s re-render will be postponed until the main thread is free. The rendered UI might briefly show stale data, but the browser stays responsive for the critical interactions.
The trade-off is obvious. The trade list might show a tick that is 300 milliseconds old. For this dashboard, that was acceptable — the order book and chart were the primary interaction surfaces. For a dashboard where every number must be perfectly current (e.g., a monitoring tool for audit compliance), this pattern is not appropriate.
Pattern Four: Virtualize the Long List
The open positions list was capped at 500 rows, but each row had 12 columns of data. Rendering 500 rows × 12 columns = 6,000 DOM nodes on every position update was consistently pushing frame time past 20 milliseconds.
The fix was not to optimize the row component further — the row was already lean. The fix was to stop rendering rows that were not visible. Using react-window, the list was converted to a virtualized grid that rendered only the visible viewport rows:
import { FixedSizeList as List } from 'react-window';

function PositionsTable({ positions }) {
  const Row = ({ index, style }) => (
    <div style={style}>
      <PositionRow position={positions[index]} />
    </div>
  );

  return (
    <List
      height={600}
      itemCount={positions.length}
      itemSize={35}
      width="100%"
    >
      {Row}
    </List>
  );
}
The DOM node count can drop from thousands to roughly the number of visible rows. Frame time for position updates can fall from tens of milliseconds to just a few milliseconds. The measurable trade-off: scrollbar behavior changes slightly (a virtualized list cannot accurately predict the total scroll height until it measures), and keyboard navigation needs extra handling. For a mouse-driven trading workstation, neither was a problem.
The Full Architecture After the Changes
The final dashboard had four independent subscription hooks (quote, orderbook, trade, and position), each feeding its own section of the tree. The order book was wrapped in React.memo with stable props. The trade list and position PnL were deferred via useDeferredValue. The positions table was virtualized.
The measured results on the same 500-message-per-second burst:
| Metric | Before | After |
|---|---|---|
| Root re-renders/sec | 500 | 4 |
| Frame time (95th percentile) | 82ms | 8ms |
| Frame rate | 12fps | 60fps |
| DOM nodes (positions table) | 6,000 | ~30 |
| Memory (heap snapshot) | 48MB | 29MB |
These four patterns build on each other. Splitting subscriptions is the foundation; without it, memoization is racing against a flood of unnecessary renders. Memoization with stable props is the next layer; without it, the order book is still re-rendering siblings on every tick. Deferral and virtualization are the final layers, shaving off the remaining waste.
When These Patterns Are Not the Right Answer
The subscription-splitting pattern adds complexity. Each hook manages its own WebSocket lifecycle, and debugging cross-channel state (e.g., computing a spread that needs both quote and orderbook data) becomes harder. If your feed delivers fewer than 50 messages per second, the single-subscription approach works fine — the render cost is trivial at that volume.
The useDeferredValue pattern is not for compliance-critical displays. A stock exchange’s official last-sale price cannot be shown as “probably current within 300ms”; it must be exact. For that use case, keep the synchronous update and accept the frame cost, or offload the number rendering to a canvas which does not trigger React re-renders at all.
Virtualization adds a dependency and introduces edge cases around measuring. If your list is shorter than about 100 rows, the complexity is not worth it — direct rendering of 100 rows is within the browser’s comfort zone.
A Practical Verification Sequence
If you are working through a similar dashboard, the order to follow is: profile first with React DevTools Profiler to see which components are re-rendering and how long each render takes. Record the baseline numbers. Split the subscription into separate hooks and profile again — you should see render frequency drop immediately. Add memoization with useMemo-stabilized props for the most frequently updating component, and verify the render count drops further. Add useDeferredValue to non-critical lists. Virtualize the longest list. After each step, record the frame time and render count — the numbers guide the next step, and they keep you from over-engineering any single section.
One additional note on the WebSocket itself: the dashboards that fail are often not the ones with the most data, but the ones where message parsing happens on the main thread. If you have control over the server payload format, ask for batched messages — a single array of 100 ticks parses in roughly the same time as 10 individual messages, because JSON.parse has a fixed overhead per call. That single change can reduce your parsing cost by an order of magnitude even before any React code is touched.
Related guides: Optimizing WebSocket Real-Time Updates in React, Reducing Re-Renders in React With Context Selectors: A Ranked Guide, and Real User Monitoring for React Performance: A Practical Guide.
🔗 Recommended Reading
- React Render Props Performance: A Beginner Tutorial
- React Performance Mistakes in Fintech Dashboards and How to Fix Them
- Lazy Loading Images and Components in React: A Step-by-Step Tutorial
- React Memoization: When and How to Use memo, useMemo, and useCallback
- Next.js App Router Performance Optimization for Beginners: A Step-by-Step Guide