An expensive-looking dashboard and a fast dashboard are two different things. Fintech UIs tend to look rich — live tickers, sparkline charts, order books, account tables, streaming price feeds — and that visual density makes it easy to assume the performance work is already handled. In practice, the opposite is often true: the more data a dashboard displays, the more likely it is to be paying for that data on every single render.
This post walks through the mistakes that recur most in fintech React dashboards, framed as myth-versus-reality, with the concrete fix for each.
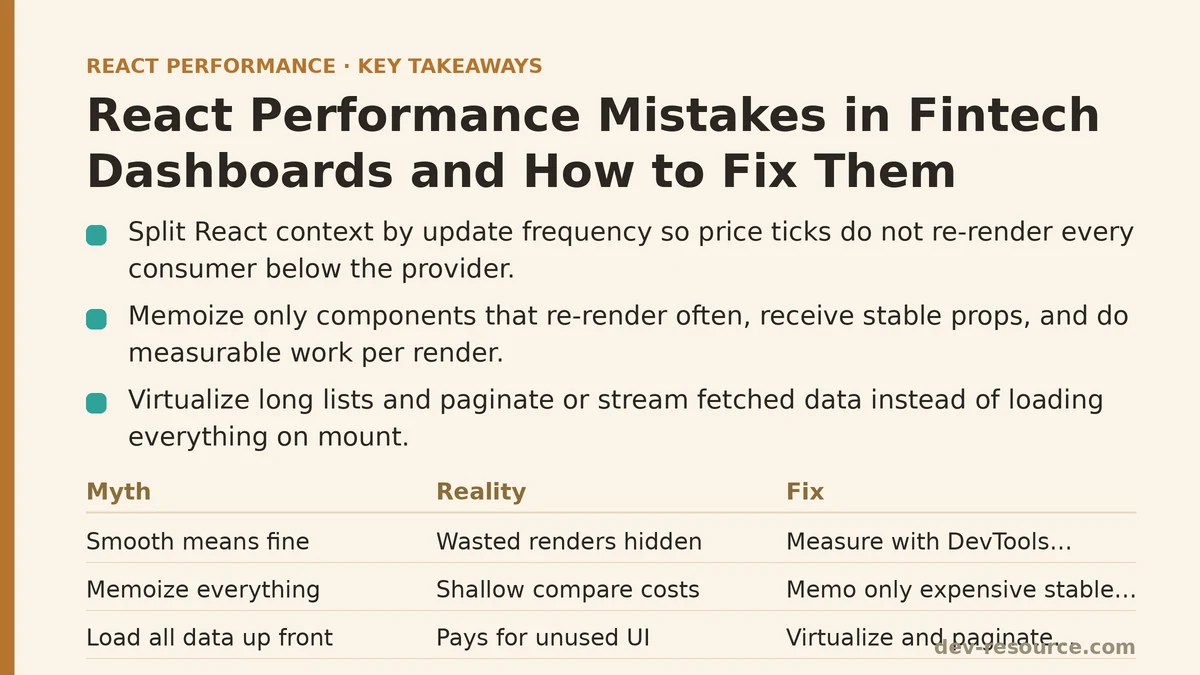
Myth 1: “If It Looks Smooth, the Render Tree Is Fine”
Reality: Visual smoothness hides wasted work. A component can re-render 40 times a second while producing identical output, and you will never see it — until the tab is on a slower machine or a hot path like an order form starts dropping keystrokes.
The fix is measurement before assumption. React DevTools Profiler’s “Ranked” chart view sorts components by how long they spent rendering, and the “flamegraph” view shows which parent triggered the render. In fintech dashboards, the usual offender is a top-level provider holding a streaming price object in state. Every tick re-renders the provider, which re-renders every consumer below it — tables, charts, sidebars — even the ones that don’t read the ticker.
Split the context by update frequency. A price feed context that changes many times a second should not share a provider with account settings or user preferences that change once a session.
// One context for everything: every tick re-renders every consumer.
const AppContext = createContext();

// Split by update cadence instead.
const PriceFeedContext = createContext();   // updates many times per second
const AccountContext = createContext();     // updates rarely
const UiStateContext = createContext();     // updates on user action only
Consumers of AccountContext stop re-rendering when prices tick, because they were never subscribed to that provider in the first place.
Myth 2: “Memoization Is a Free Win, So Wrap Everything”
Reality: React.memo performs a shallow prop comparison on every render. For a component that renders in under a millisecond, that comparison can cost roughly as much as the render it prevented — and if the props are unstable references, the memo may never hit anyway. Blanket memoization tends to add code without adding speed.
The condition that makes memoization worthwhile in a fintech dashboard is specific: a component that re-renders frequently because a parent re-renders, receives props that are referentially stable across those renders, and does enough work per render that skipping it is measurable.
A common failure mode is passing an inline object or function to a memoized child:
// Child is wrapped in React.memo, but this still re-renders on every parent pass.
<TradeRow
  onSelect={() => selectTrade(trade.id)}
  style={{ padding: 8 }}
/>
Both the arrow function and the object literal are recreated each render, so the shallow comparison fails. Stabilize them:
const handleSelect = useCallback(() => selectTrade(trade.id), [trade.id]);
const rowStyle = useMemo(() => ({ padding: 8 }), []);

<TradeRow onSelect={handleSelect} style={rowStyle} trade={trade} />
When not to reach for memo: components that are cheap to render, or that re-render because their own data changed. If the data changed, the render is necessary and memoization cannot help.
Myth 3: “Loading All the Data Up Front Is Simpler and Fine”
Reality: A dashboard that mounts with 5,000 rows of trade history, three charts, and a full order book pays for all of it before the first paint. Users typically interact with a small slice of that surface at any moment — a viewport’s worth of table rows, one chart in focus, the top of the order book.
Two fixes apply here, and they are independent.
Virtualize long lists. Libraries like @tanstack/react-virtual or react-window render only the rows currently in view, plus a small overscan buffer.
import { useVirtualizer } from '@tanstack/react-virtual';

function TradeTable({ trades }) {
  const parentRef = useRef(null);
  const rowVirtualizer = useVirtualizer({
    count: trades.length,
    getScrollElement: () => parentRef.current,
    estimateSize: () => 32,
    overscan: 8,
  });

  return (
    <div ref={parentRef} style={{ height: 480, overflow: 'auto' }}>
      <div style={{ height: rowVirtualizer.getTotalSize(), position: 'relative' }}>
        {rowVirtualizer.getVirtualItems().map((v) => (
          <TradeRow
            key={trades[v.index].id}
            trade={trades[v.index]}
            style={{
              position: 'absolute',
              top: 0,
              transform: `translateY(${v.start}px)`,
              height: v.size,
            }}
          />
        ))}
      </div>
    </div>
  );
}
Paginate or stream what you fetch. Loading 100 rows on mount and fetching more as the user scrolls keeps the initial payload small. Order book depth is a good candidate: show the top N levels and expand on demand.
When not to virtualize: short lists (tens of rows) where the added complexity is not worth it, and tables that need to be printable or copied in full — virtualization can break select-all and browser find.
Myth 4: “One WebSocket Update Should Just Update the Component”
Reality: Setting a WebSocket-driven value into React state on every message means every message triggers a render. For a price feed arriving at 50 messages per second, that is 50 renders per second, multiplied by however many components subscribe.
The standard fix is to coalesce updates. Buffer incoming messages and flush them on an animation frame, so state changes at most 60 times per second — and, more usefully, only when there is something new to show.
function useCoalescedFeed(socket, intervalMs = 16) {
  const [snapshot, setSnapshot] = useState({});
  const bufferRef = useRef({});

  useEffect(() => {
    const onMessage = (msg) => {
      const { symbol, price } = JSON.parse(msg.data);
      bufferRef.current[symbol] = price;
    };
    socket.addEventListener('message', onMessage);

    const timer = setInterval(() => {
      if (Object.keys(bufferRef.current).length === 0) return;
      setSnapshot((prev) => ({ ...prev, ...bufferRef.current }));
      bufferRef.current = {};
    }, intervalMs);

    return () => {
      socket.removeEventListener('message', onMessage);
      clearInterval(timer);
    };
  }, [socket, intervalMs]);

  return snapshot;
}
Trade-off to be aware of: coalescing is right for a display ticker, but wrong where the exact sequence of messages matters — a fill report or an order acknowledgement. Keep those on a separate, unbatched channel so no update is dropped.
Myth 5: “Charting Libraries Are Just Slow, Nothing to Do”
Reality: Charting libraries are usually not the bottleneck. The bottleneck is that they receive a new array of data points on every render, forcing a full series recalculation even when the underlying data has not changed.
The fix follows from Myth 2: memoize the data array itself and let the chart component memo on it.
const series = useMemo(
  () => prices.map((p) => ({ x: p.time, y: p.value })),
  [prices]
);

<LineChart data={series} />
If the chart library exposes an imperative update path (a setData-style method), calling it directly on new data avoids a React render entirely. Reserve that pattern for chart components where the render is the expensive part — it adds state-sync complexity that is not worth the maintenance for ordinary UI.
Myth 6: “Layout Shift on a Trading Screen Is Cosmetic”
Reality: In a fintech dashboard, layout shift is a correctness problem. If a row of the order book moves while the user is clicking, they can submit an order at the wrong price. This is where performance and safety overlap.
Two habits prevent most of it:
- Give every image, ticker badge, and numeric cell a reserved width. Numeric columns should use
font-variant-numeric: tabular-numsand a fixed or min-width so digits do not reflow as values change. - Avoid rendering
nullin place of a component that fetches data; render a skeleton with the same dimensions instead.
Reserving space also helps Largest Contentful Paint, since the browser can lay out the page before the data arrives.
Myth 7: “A Big Bundle Is a Bundler Problem, Not Mine”
Reality: Bundles are commonly reducible by 30–50% through decisions made at the component level, not just via bundler config. Fintech dashboards tend to pull in date libraries, chart libraries, and CSV/PDF export utilities — all of which are prime candidates for code splitting.
Route- and component-level lazy loading moves that weight off the critical path:
import { lazy, Suspense } from 'react';

const ExportPanel = lazy(() => import('./ExportPanel'));

<Suspense fallback={<ExportPanelSkeleton />}>
  <ExportPanel visible={showExport} />
</Suspense>
Combine that with the bundler’s analyzer to see what is pulling weight. Vite’s rollup-plugin-visualizer and webpack’s webpack-bundle-analyzer both produce a treemap that makes the biggest offenders obvious. Check whether a date library is being imported with full locale data, and whether a chart library supports tree-shakeable imports of only the chart types in use.
A Quick Decision Table
| Symptom | Likely Cause | First Fix |
|---|---|---|
| Every component re-renders on each price tick | Shared context provider | Split context by update frequency |
React.memo has no effect |
Unstable prop references | Stabilize with useCallback / useMemo |
| Initial load is slow with large tables | Rendering all rows | Virtualize with @tanstack/react-virtual |
| Tab freezes under live feeds | State set on every message | Coalesce to animation frames |
| Charts recompute on every render | New array identity per render | Memoize the data array |
| Numbers jitter and shift the layout | Variable-width numeric cells | tabular-nums + reserved width |
| Bundle over 1 MB gzipped | Eagerly imported heavy libraries | Route/component lazy + analyzer |
What Changes Once Measurement Comes First
The improvement in a fintech dashboard usually comes from a small number of targeted changes rather than a rewrite: splitting one context, coalescing one feed, virtualizing one table. The recurring pattern across every mistake above is the same — assume less, measure more, and fix the specific component that shows up in the Profiler instead of applying a pattern everywhere on instinct.
If you are working on a dashboard that feels sluggish under load, the Profiler’s ranked view is the fastest place to start. Watch which components re-render without their props changing, and work outward from there.
🔗 Recommended Reading
- Lazy Loading Images and Components in React: A Step-by-Step Tutorial
- React Memoization: When and How to Use memo, useMemo, and useCallback
- Next.js App Router Performance Optimization for Beginners: A Step-by-Step Guide
- Measuring and Fixing React Re-render Performance: A Step-by-Step Walkthrough
- Web Vitals Optimization for React SPAs: A Step-by-Step Guide