The most common React performance complaint — “my app feels slow” — is usually not caused by any single expensive component. It’s caused by a large number of components re-rendering when nothing they depend on has changed. A component tree that re-renders five times for every one meaningful state update burns CPU cycles on work that produces identical output, and the cost compounds as the tree grows. The fix is rarely a mystery once you know which components are re-rendering and why; the difficulty is in the measurement, because React gives you no obvious signal that a re-render was wasteful. This walkthrough covers the full loop: how to capture a profile, how to read it, how to trace a wasted render back to its cause, and how to verify the fix without introducing new problems.
Why “the app is slow” is the wrong starting point
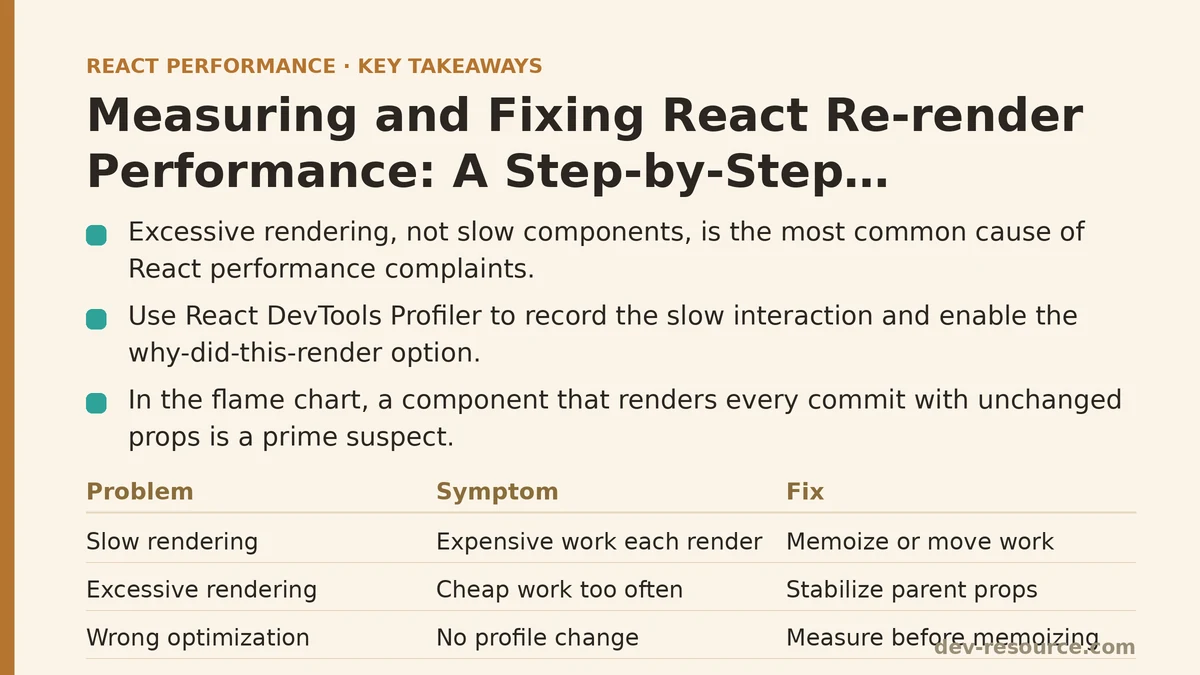
Before opening the Profiler, it helps to separate two different problems that both present as sluggishness. The first is slow rendering: a component does expensive work on every render. The second is excessive rendering: a component does cheap work, but it does it far more often than necessary. These have different fixes. A slow component needs its work memoized or moved out of the render path. An excessively-rendering component needs its parent to stop passing new references on every update.
Optimizing the wrong one wastes effort. Wrapping a cheap component in React.memo when the real problem is that a sibling is doing heavy computation on every keystroke will show nothing in the profile. That’s why the first step is always measurement, not memoization.
Step one: capture a profile of the interaction that feels slow
React DevTools ships with a Profiler tab that records every commit — the point where React applies a set of changes to the DOM — along with which components rendered in each commit and how long each took. The workflow is consistent:
- Open React DevTools, switch to the Profiler tab, and click the record button.
- Perform the interaction that feels slow — typing into a search field, toggling a filter, opening a modal. Keep the interaction narrow; profiling a whole session produces noise.
- Stop recording. The Profiler renders a bar chart of commits along the top and a ranked list of components by render time below.
The two settings that matter most are in the Profiler’s gear menu. Enable “Record why each component rendered while profiling” — this annotates every component with the reason React re-rendered it, which is the single most useful piece of information in the entire tool. Also consider enabling “Highlight updates when components render” in the general settings, which flashes a border around components as they re-render so you can see the blast radius of a single state change without recording at all.
Step two: read the flame chart for wasted renders
Here is where the profile becomes actionable. In the flame chart, each commit shows a tree of components. Gray components did not render in that commit. Colored components did. A component that consistently renders in every commit while its displayed props are unchanged is a prime suspect.
React 16.8 and later annotate each rendered component with a reason, visible when you click it in the Profiler:
- “Props changed” — the props are referentially different from the last render.
- “State changed” — a
useStateoruseReducerupdate fired. - “Parent re-rendered” — the component re-rendered only because its parent did, with no prop or state change of its own. This is the wasted-render signal.
A component showing “Parent re-rendered” repeatedly, with the “props changed” indicator off, is doing work that produces the same output. That’s the target.
Step three: trace the cause back to the parent
The reason label tells you that a render was wasted, not why the parent re-rendered in the first place. In a typical case, a state update high in the tree — a search input’s value, for instance — re-renders a whole subtree, and most of that subtree doesn’t depend on the changed value.
Consider a search page structured like this:
function SearchPage() {
  const [query, setQuery] = useState('');
  const [results, setResults] = useState([]);

  useEffect(() => {
    fetchResults(query).then(setResults);
  }, [query]);

  return (
    <div>
      <SearchInput value={query} onChange={setQuery} />
      <FilterPanel filters={staticFilters} />
      <ResultsList results={results} />
    </div>
  );
}
Every keystroke updates query, which re-renders SearchPage, which re-renders FilterPanel and ResultsList even though neither depends on query. If ResultsList renders a few hundred rows, each keystroke pays for re-rendering all of them. The Profiler will show ResultsList lighting up on every commit with the reason “Parent re-rendered.”
Step four: pick the right fix for the cause
There are three fixes, and choosing the wrong one is where most optimization attempts stall.
Fix A — Isolate the state. If only SearchInput needs query, the state doesn’t belong in SearchPage. Lifting state up is a common instinct, but for frequently-changing values it’s often the opposite of what you want:
function SearchInput({ onSearch }) {
  const [query, setQuery] = useState('');
  return (
    <input
      value={query}
      onChange={(e) => {
        setQuery(e.target.value);
        onSearch(e.target.value);
      }}
    />
  );
}

function SearchPage() {
  const [results, setResults] = useState([]);
  return (
    <div>
      <SearchInput onSearch={(q) => fetchResults(q).then(setResults)} />
      <FilterPanel filters={staticFilters} />
      <ResultsList results={results} />
    </div>
  );
}
Now keystrokes update SearchInput’s local state, and SearchPage only re-renders when results changes. This is usually the cleanest fix because it removes the problem rather than working around it.
Fix B — Stabilize prop references. If a child must re-render on parent updates but is receiving new object or function references on every render, memoization will fail silently. React.memo does a shallow comparison, so a new inline object defeats it:
// Memoization has no effect here:
// the object and function are recreated every render.
<Chart data={{ points }} onSelect={() => select(points)} />

// Stable references let React.memo work as intended:
const data = useMemo(() => ({ points }), [points]);
const handleSelect = useCallback(() => select(points), [points]);
<Chart data={data} onSelect={handleSelect} />
Fix C — Memoize the component boundary. React.memo is the right tool only once the props it receives are stable. Applying it to a component that still receives fresh references every render changes nothing and adds comparison overhead on every pass.
Step five: verify with a second profile
After applying a fix, record the same interaction again and compare commit counts. The number of colored components in the flame chart should drop, and the wasted-render candidates should either be gray or gone. Use the Profiler’s ranked view to sort by render time and confirm the total commit duration fell.
A common failure mode appears here: a fix that looks correct in the code can still leave memoization defeated by a dependency array mistake. A useCallback with a missing or unstable dependency recreates its function on every render, which re-renders the memoized child anyway. The only reliable check is the second profile, not a re-read of the code.
When not to apply these fixes
Memoization is not free. Every React.memo wrapper adds a shallow comparison on every parent render. For components that are cheap to render and only re-render occasionally, that comparison can cost more than the render it prevents, producing no improvement or a slight regression. The Profiler makes this visible: if a component takes under roughly a millisecond to render in the ranked list and doesn’t render in rapid bursts, skipping it costs you nothing.
Isolating state is not always available either. If several distant parts of the tree depend on the same frequently-changing value, moving that state down means threading it back up through context or a state manager, which reintroduces the re-render problem in a different form. In those cases the realistic answer is splitting the tree so that only the value’s direct consumers re-render, not the whole subtree.
The loop that produces results
The reliable process is short and repeatable: profile the interaction, find components rendering with the reason “Parent re-rendered,” trace the cause to the state or prop that changed, apply the smallest fix that removes the cause, then profile again to confirm the commit count fell without a new cost appearing. The measurement catches both the wasted renders and the fixes that quietly failed. Skipping the first or last profile is what turns React optimization into guesswork, and guesswork is where memoization gets a bad reputation.
Related guides: Profiling React Apps with the Chrome DevTools Performance Tab: A Step-by-Step Guide, Reducing Re-Renders in React With Context Selectors: A Ranked Guide, and The Real Performance Impact of Inline Functions and Objects in JSX.
🔗 Recommended Reading
- React Performance Mistakes in Fintech Dashboards and How to Fix Them
- Lazy Loading Images and Components in React: A Step-by-Step Tutorial
- React Memoization: When and How to Use memo, useMemo, and useCallback
- Next.js App Router Performance Optimization for Beginners: A Step-by-Step Guide
- Web Vitals Optimization for React SPAs: A Step-by-Step Guide