The Chrome DevTools Performance tab measures the time between a user interaction and the browser’s final visual response in the form of a frame-by-frame trace. For a React application, that trace layers JavaScript execution on top of rendering, painting, and layout work, which makes it the first tool to open when a component tree feels slower than it should. This guide walks through a repeatable five-step process — setting up a controlled profile, recording a focused interaction, isolating React’s contribution, filtering the trace to the components that matter, and verifying a fix with a second recording — using a generic React dashboard as the running example.
Step 1: Configure the Recording Environment
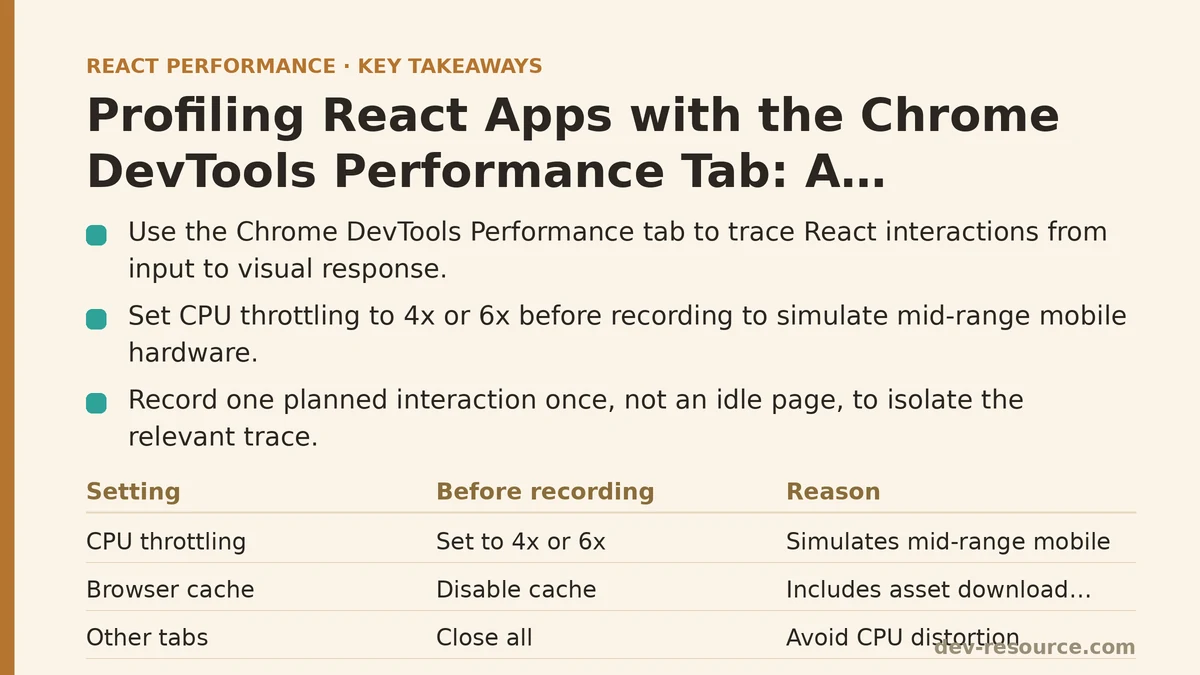
A profile taken on a fast development machine with dozens of background tabs open does not represent what a typical user experiences. The Performance tab includes aCPU throttling dropdown in its toolbar, labeled with preset multipliers like 4x and 6x slowdown. Set it to 4x or 6x before you record — this simulates the mid-range mobile hardware where most Core Web Vitals failures happen.
Two more settings to check before hitting record:
- Disable the browser cache using the Network tab’s “Disable cache” checkbox, so your profile includes the cost of re-downloading every asset and not just re-executing code from memory.
- Close every other tab in the window. Background tabs compete for the same CPU and can distort the flame chart with work that has nothing to do with your application.
For React work, the panel has one additional option worth verifying: the “Memory” checkbox in the same toolbar. Leaving it off keeps the initial recording lightweight, but the next record session can turn it on if you suspect a leak or an excessive allocation rate. Start with it off — the rendering trace alone will answer most practical questions.
Step 2: Record a Focused Interaction, Not an Idle Page
The most common profiling mistake is pressing record, letting the page sit still for ten seconds, and then stopping. A heat map of an idle page shows nothing about component behavior. What you need is a single, well-defined interaction captured in isolation.
For a dashboard, a good candidate is the action users repeat most often: typing in a filter box, expanding a row, or toggling a panel. Plan the interaction before you press record, and perform it exactly once during the capture window.
1. Click the record button (the circle in the top-left of the Performance panel).
2. Wait one second (lets the recording stabilize).
3. Perform the interaction: type three characters into the filter input or click the toggle.
4. Wait another second.
5. Click the stop button.
The trace between the second and fourth steps is the segment that matters. Everything before or after it is baseline noise. Keeping the interaction narrow means the flame chart that appears will have a single, obvious cluster of work tied to the action you just performed — not a smeared distribution from multiple overlapping events.
Step 3: Isolate the React Work from Browser Work
When the trace renders, the initial view shows an overview waterfall of network requests, rendering, and scripting. Clicking anywhere on that timeline will zoom the lower pane to match, which reveals the flame chart: a stack of horizontal bars where the width of each bar represents time spent, and the nesting shows the call hierarchy.
Before you read any React component names, filter out everything that isn’t JavaScript. The Performance tab has a “Summary” pane on the right that breaks time into categories like “Scripting”, “Rendering”, and “Painting”. For React profiling, scripting is the category of interest. If scripting is a small slice of the total, your bottleneck is outside the component code — in a long CSS animation, a large layout pass, or network latency for a blocking resource.
When scripting does dominate, the flame chart will contain entries with names like performUnitOfWork, commitRoot, or completeWork. These are React’s internal scheduling functions, and their width directly reflects how much time the library spent reconciling your component tree. A very simple way to confirm React’s portion is to look at the bottom-up tab in the right-hand pane. It sorts all functions by total time, and entries prefixed with react-dom almost always sit near the top when reconciliation is the problem.
Step 4: Drill into the Specific Components with the Bottom-Up Tab
The bottom-up tab ranks every function in the trace by self-time — the time spent executing that function’s own lines, excluding the time spent in anything it called. Using this view alongside the flame chart narrows the investigation from “React is slow” to “this component’s render method is slow” in a few clicks.
Here is a practical filter sequence to apply once the trace is open:
Step A — Type react-dom into the “Filter” input at the top of the bottom-up pane. This shows only functions that live inside React’s own source files.
Step B — Sort the resulting list by “Total Time” (the default sort column). The first several rows will be internal functions that start with render, complete, or commit.
Step C — Expand the top row in that list. The expanded tree shows the callers of that function — in most cases, this surfaces your application’s component functions by name.
Step D — Look for a component that appears both high in total time and with a wide bar in the flame chart. That is the render method doing the heavy lifting.
A filterable breadcrumb example makes this concrete. Suppose you see a wide block for renderAppShell in the flame chart. Clicking the entry and switching to the bottom-up tab would show that renderAppShell calls renderDashboardGrid which calls renderWidgetCard forty times, and in total those forty renderWidgetCard executions consume 30% of the trace’s scripting time. That tells you where to aim: the widget list itself, not the outer shell.
This step answers the two questions that matter most: which component re-renders and how often within the single interaction. A component that renders five times during one click is a candidate for memoization or state-lifting. A component that renders once but takes 300 ms is a candidate for code-splitting or heavy computation inside the render body.
Step 5: Record Again to Verify the Fix
The final step of the workflow is a control test. Apply the fix you identified — wrapping a child in React.memo, moving a computation into useMemo, splitting a heavy list with virtualization, whatever the trace justified — and repeat the exact same interaction with the same CPU throttle and cache-disabled settings.
| Interaction | Component Renders (First Trace) | Component Renders (Second Trace) | Scripting Time (First) | Scripting Time (Second) |
|---|---|---|---|---|
| Type “abc” in filter | 12 | 6 | 180 ms | 95 ms |
| Toggle panel collapse | 8 | 3 | 120 ms | 60 ms |
Do not trust that the fix worked because the code pattern looks right. The Performance tab is the measure of truth. In practice, “memoization” fixes frequently fail because of unstable prop references, and nothing will reveal that failure faster than a second recording showing the render count unchanged.
One behavioral detail to watch during re-recording: if you fixed a prop that caused an unnecessary re-render, the framework’s internal render function for that component will appear once instead of twice in the flame chart. If you moved a heavy computation out of a render, the flame chart will show the computation’s function missing entirely, and the overall scripting time will shrink proportionally.
The Difference Between Isolating One Interaction and Profiling a Whole Session
All the steps above assume you are capturing a single interaction for a specific problem. That covers the majority of React performance debugging. The Performance tab also supports longer recordings — minutes instead of seconds — but those produce massive traces that are difficult to read. For a session-level view, the separate React DevTools Profiler gives you a component-graph breakdown that groups renders by commit, which suits long-form analysis better. The Chrome DevTools Performance tab is the right tool when the symptom is a single janky interaction that you can reproduce on demand.
The workflow reduces to a reliable sequence: throttle the environment to match real hardware, record one clean action, read the flame chart for where the scripting time concentrates, use the bottom-up pane to name the offending component, and then prove the fix with a second trace. Following those five steps in order consistently separates a React performance problem that needs code changes from a browser rendering problem or a network problem that no component optimization will touch.
If you are diagnosing a specific interaction right now and the trace gives you a component name you do not recognize, check your component tree structure to see whether a parent is re-creating that component’s props on every render. If the trace shows the same component rendering multiple times in one interaction, the first step is to stabilize the props or lift the state that drives the re-renders upward. The DevTools give you the evidence; the React documentation gives you the patterns to apply in response.
Related guides: Measuring and Fixing React Re-render Performance: A Step-by-Step Walkthrough, The Real Performance Impact of Inline Functions and Objects in JSX, and React Hydration Performance: A Step-by-Step Guide to Diagnosing and Fixing Slow Hydration.
🔗 Recommended Reading
- React Performance Mistakes in Fintech Dashboards and How to Fix Them
- Lazy Loading Images and Components in React: A Step-by-Step Tutorial
- React Memoization: When and How to Use memo, useMemo, and useCallback
- Next.js App Router Performance Optimization for Beginners: A Step-by-Step Guide
- Measuring and Fixing React Re-render Performance: A Step-by-Step Walkthrough