Say you are trying to figure out why your React dashboard scores a 96 on Lighthouse in CI, yet support tickets keep coming in describing the app as “slow” and “laggy” for a chunk of your customer base. You open the app yourself, on your fast office connection and your recent-model laptop, and it feels instant. This gap between synthetic scores and lived experience is one of the most common reasons teams eventually adopt real user monitoring (RUM), and walking through how that diagnosis actually plays out is more useful than reciting RUM theory in the abstract.
The Setup: A Dashboard That Passes Every Synthetic Test
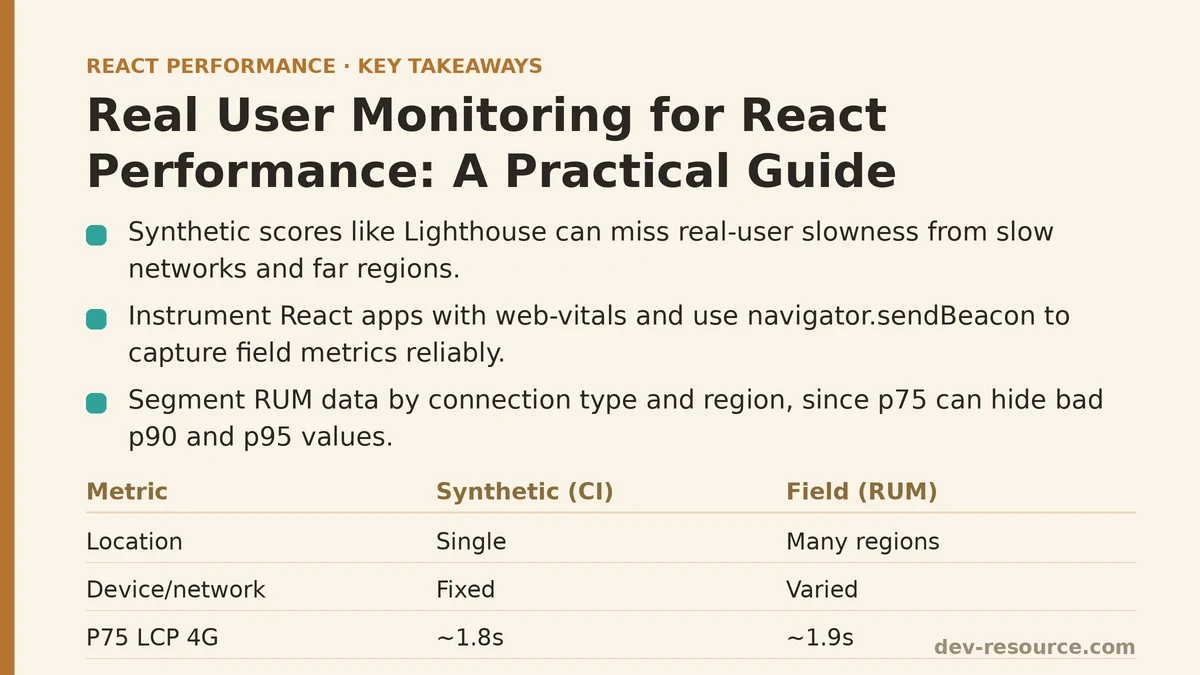
The application in question was an internal analytics dashboard built with React and a data-fetching layer on top of REST endpoints. Lighthouse, run in CI on every pull request, consistently reported strong Core Web Vitals: an LCP around 1.8 seconds, a CLS near zero, and an INP comfortably under 200ms. By every synthetic measure available to the team, the app was fast.
The support tickets told a different story. Several customers, concentrated in a couple of regions, described the dashboard as taking “forever” to become interactive after a page navigation. A few mentioned that typing into filter fields felt delayed. None of this showed up in the CI reports, and none of it reproduced reliably when engineers tested manually.
This is precisely the blind spot synthetic testing has by design. Lighthouse runs from a single location, on a fixed device profile, with a fixed network throttle. It tells you how the app performs under one specific, controlled condition. It cannot tell you how the app performs for a customer on a mid-tier Android phone on a congested hotel Wi-Fi network in a region several hundred milliseconds from your origin server. For that, you need data from the field, not the lab.
Step 1: Instrumenting Core Web Vitals in the Actual App
Before any RUM vendor or dashboard was introduced, the first step was getting real field measurements at all. The team added Google’s web-vitals library directly into the app’s entry point, since it provides a lightweight, standards-based way to capture the same metrics Lighthouse approximates, but from real browser sessions.
import { onCLS, onINP, onLCP, onTTFB } from 'web-vitals';

function sendToAnalytics(metric) {
  const body = JSON.stringify({
    name: metric.name,
    value: metric.value,
    id: metric.id,
    navigationType: metric.navigationType,
  });

  // Use sendBeacon so the request survives page unload
  navigator.sendBeacon('/analytics/vitals', body);
}

onCLS(sendToAnalytics);
onINP(sendToAnalytics);
onLCP(sendToAnalytics);
onTTFB(sendToAnalytics);
Two details here mattered more than expected once the data started flowing. First, navigator.sendBeacon was used instead of a standard fetch call, because beacon requests are designed specifically to complete reliably even as the page is unloading — a fetch call fired during a route change can simply get cancelled before it reaches the server. Second, metric.navigationType turned out to be essential for later analysis, since it distinguishes a fresh page load from a back/forward navigation from a client-side route change, and those three cases behave very differently in a single-page React app.
Step 2: What the Field Data Revealed That Lighthouse Missed
Within a week, a clear pattern emerged in the collected data that no CI run had ever surfaced. When the metrics were segmented by connection type (using the navigator.connection.effectiveType value, where available) and by geographic region, the p75 LCP for users on “4g” effective connection type in the primary market matched the CI numbers closely, sitting around 1.9 seconds.
But the p90 and p95 LCP values, for users flagged with “3g” effective connection type or a round-trip time above 300ms, told a very different story: LCP times climbing past 6 seconds for a meaningful slice of sessions. Lighthouse’s default mobile throttle setting simulates a 4G-equivalent connection, so a large tail of genuinely slower connections was structurally invisible to the CI pipeline no matter how many times it ran.
This is the core argument for RUM that’s easy to state but hard to appreciate until you have your own numbers in front of you: the lab tells you about one condition, and production users generate a distribution of conditions. A single average or a single synthetic run flattens that distribution into a single, misleadingly reassuring point.
Step 3: Correlating INP Regressions With Specific Interactions
The filter-field complaint needed a different approach than LCP, since INP (Interaction to Next Paint) measures responsiveness across every interaction on the page, not just the initial load. Rather than reporting one aggregate INP number, the team modified the collection code to also capture the target element involved in the slowest interactions.
import { onINP } from 'web-vitals/attribution';

onINP((metric) => {
  const attribution = metric.attribution;
  navigator.sendBeacon('/analytics/inp', JSON.stringify({
    value: metric.value,
    target: attribution.interactionTarget,
    eventType: attribution.interactionType,
    inputDelay: attribution.inputDelay,
    processingDuration: attribution.processingDuration,
    presentationDelay: attribution.presentationDelay,
  }));
});
The web-vitals/attribution build breaks a single INP number down into its component phases: input delay, processing duration, and presentation delay. Once that breakdown started arriving in production data, the pattern was immediate. Interactions tagged with the filter input’s element ID showed processing durations regularly exceeding 300ms, while nearly every other interaction on the page stayed well under 50ms. The bottleneck was isolated to one component, on real devices, under real load — something that would have taken far longer to find by guessing from code review alone.
Step 4: Finding the Cause Once the Symptom Was Localized
With attribution data pointing directly at the filter component, the code review that followed was short. The filter input was wired to an onChange handler that ran an unmemoized, expensive filtering pass over a dataset held in memory, on every keystroke, with no debouncing.
// Before: runs the full filter operation on every keystroke
function FilterInput({ data, onFilter }) {
  const [query, setQuery] = useState('');

  function handleChange(e) {
    const value = e.target.value;
    setQuery(value);
    const filtered = data.filter(item =>
      item.name.toLowerCase().includes(value.toLowerCase())
    );
    onFilter(filtered);
  }

  return <input value={query} onChange={handleChange} />;
}
On a fast desktop this ran quickly enough that no one noticed. On a mid-tier mobile CPU, with a dataset in the low thousands of rows, this same operation blocked the main thread long enough to register as a poor INP score, exactly matching what the field data had already shown. The fix combined a debounce on the expensive operation with moving the filtering into a useMemo keyed on the debounced value, so keystrokes stayed cheap and the filtering pass ran far less often.
// After: input stays responsive, filtering runs on a debounced value
function FilterInput({ data, onFilter }) {
  const [query, setQuery] = useState('');
  const debouncedQuery = useDebouncedValue(query, 200);

  const filtered = useMemo(() => {
    return data.filter(item =>
      item.name.toLowerCase().includes(debouncedQuery.toLowerCase())
    );
  }, [data, debouncedQuery]);

  useEffect(() => {
    onFilter(filtered);
  }, [filtered, onFilter]);

  return <input value={query} onChange={(e) => setQuery(e.target.value)} />;
}
Step 5: Confirming the Fix With Field Data, Not Just Local Testing
The lesson from the React.memo cases that don’t pan out applies here too: a fix that looks correct in a code review still needs to be verified against the same data source that surfaced the problem. Shipping the debounced version and then watching the production INP attribution data over the following two weeks showed the p95 INP for the filter interaction drop from over 400ms to under 120ms, with the input delay and processing duration components both flattening out.
Just as important, the regional LCP gap from Step 2 was addressed separately, through a CDN configuration change and a reduction in an oversized bundle that was disproportionately affecting slower connections. That fix was also verified through the same RUM pipeline, segmented by effective connection type, rather than through another isolated Lighthouse run.
Building This Into an Ongoing Practice, Not a One-Time Fix
Once the dashboard team had this pipeline running, the natural next step was making it a permanent part of how performance regressions get caught, rather than a one-off investigation. A few practices came out of that shift:
Segment everything by connection and device, not just by an overall average. A single p75 number across your entire user base can hide a badly underserved segment the same way Lighthouse’s fixed throttle setting can.
Keep both a lab tool and a field tool running. Lighthouse in CI still catches regressions before they reach production; RUM catches the regressions that only manifest under real-world conditions the lab can’t simulate.
Use attribution data before reading code. Knowing which interaction, and which phase of that interaction, is slow narrows a codebase-wide search down to a single component in minutes rather than hours.
Treat a fix as unverified until the field data confirms it. A change that looks right and even measures well locally can still miss the actual cause, or introduce a new one, and the only way to know is watching the same metric that flagged the original problem return to normal.
Where This Leaves the Debugging Process
Synthetic testing and real user monitoring answer different questions, and the dashboard case above only got resolved because both were available. Lighthouse said the app was fine. Production data said otherwise, for a specific and identifiable segment of users, on a specific and identifiable interaction. Closing that gap is less about picking one tool over the other and more about building a habit of checking field data whenever the lab numbers and the support queue start disagreeing with each other.
If your synthetic scores look healthy but your users are reporting a slow experience, what does your current setup tell you about connection type, device tier, or specific interactions? That’s usually where the discrepancy is hiding.
Related guides: Measuring Core Web Vitals in React Apps: Myth vs. Reality, How to Cut a React App’s Image Load Time: A Practical Guide, and Optimizing Infinite Scroll Performance in React: A Practical Q&A.
🔗 Recommended Reading
- React Render Props Performance: A Beginner Tutorial
- React Performance Mistakes in Fintech Dashboards and How to Fix Them
- Lazy Loading Images and Components in React: A Step-by-Step Tutorial
- React Memoization: When and How to Use memo, useMemo, and useCallback
- Next.js App Router Performance Optimization for Beginners: A Step-by-Step Guide