The React DevTools Profiler can show a flame graph full of bars and still leave you without an answer to the simplest question: how long did this specific component take to render? The Profiler API exists for exactly that gap. It gives you the same underlying render timing data DevTools uses, but exposes it directly in your code, where you can log it, aggregate it, send it to an analytics endpoint, or assert on it in a test.
What the Profiler API Measures (and What It Doesn’t)
The <Profiler> component wraps a subtree and calls an onRender callback every time that subtree commits. The callback receives a phase ("mount", "update", or "nested-update"), an actualDuration, a baseDuration, and a startTime/commitTime pair.
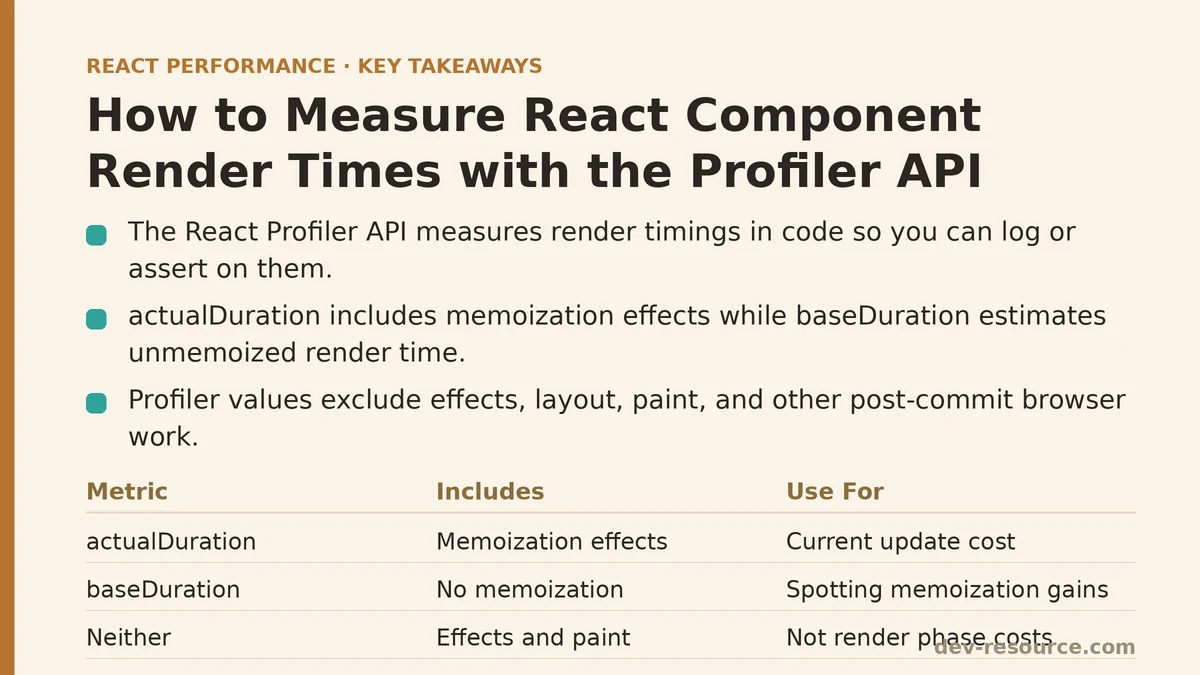
The distinction that trips people up most often is between actualDuration and baseDuration:
actualDurationis the time spent rendering the profiled subtree for the current update, including the effect of memoization. If a child is wrapped inReact.memoand skipped, that time is not counted here.baseDurationis an estimate of how long the subtree would take to render from scratch, with no memoization. It is useful for spotting components where memoization is doing heavy lifting — a large gap between the two numbers is one signal that memoization is paying off.
Neither value includes time spent in effects, layout, paint, or the browser’s own work after commit. If a component appears fast in the Profiler but the page still feels sluggish, the cost is likely downstream of React’s render phase.
Setting Up a Profiler Boundary
The API ships with React itself. No extra package is required in development or production builds, though the React team recommends against shipping profiler boundaries to production unless you specifically want that instrumentation there.
import { Profiler } from 'react';

function onRenderCallback(
  id,
  phase,
  actualDuration,
  baseDuration,
  startTime,
  commitTime
) {
  console.log({
    id,
    phase,
    actualDuration: actualDuration.toFixed(2),
    baseDuration: baseDuration.toFixed(2),
    commitTime,
  });
}

function App() {
  return (
    <Profiler id="Dashboard" onRender={onRenderCallback}>
      <Dashboard />
    </Profiler>
  );
}
The id prop is a string label you choose. It shows up in every callback invocation, which matters once you have more than one boundary in the tree. Naming them by the feature or route they wrap ("Dashboard", "CheckoutCart", "UserFeed") keeps the log readable.
Where to Place Boundaries
A boundary should wrap the smallest subtree that corresponds to a question you are trying to answer. Two patterns cover most needs:
Wrap a feature root when you want to know the total render cost of a screen section. Everything inside Dashboard, including its children, contributes to the actualDuration reported for that boundary.
Wrap a suspected culprit when a flame graph has already pointed you at one component and you want numbers, not visuals. A boundary around a single expensive list row, for example, will produce one entry per row per commit — useful, but noisy if the list is long.
Avoid wrapping every component in the tree. Each boundary adds a small amount of bookkeeping, and the log output becomes unreadable quickly. Two or three well-chosen boundaries typically answer more than a dozen scattered ones.
Symptom, Cause, Fix
Symptom: The callback fires far more often than expected
Cause: The boundary wraps a subtree that re-renders on every parent update, including updates that don’t change anything visible. State living higher in the tree than it needs to is the usual root.
Fix: Move state down to the component that owns it. If a parent holds a piece of state only to pass it to one child, that state can often live in the child instead, which stops the parent from re-rendering at all and stops the profiler from firing on unrelated updates.
Symptom: actualDuration is tiny but the app still feels slow
Cause: The expensive work is happening after render — in a useEffect, in a layout effect, in a synchronous third-party library call inside an event handler, or in the browser’s paint and layout pass.
Fix: The Profiler API won’t help here. Switch to the browser’s Performance panel, record a trace, and look at the flame chart outside of the React frames. Long tasks in the “Scripting” or “Rendering” categories usually point at the real cost.
Symptom: The onRender callback fires with phase "nested-update" and a small duration you can’t explain
Cause: A state update was scheduled from inside an effect during the same commit, triggering a second render pass. This is normal React behavior, but it can look like a phantom render in the logs.
Fix: Look for setState calls inside useEffect or useLayoutEffect that could be derived during render instead. Moving derived values out of effects and into render-time computation reduces the number of commits the profiler observes.
Symptom: Two boundaries report overlapping durations that don’t add up
Cause: Boundaries nest. An inner boundary’s time is also counted in the outer boundary’s actualDuration. Summing sibling durations is fine; summing nested durations double-counts.
Fix: Either read only the outermost boundary’s number, or read only leaf boundaries. Mixing levels produces totals that are larger than the actual commit time.
Symptom: Profiler data in development doesn’t match what users experience
Cause: Development builds of React are significantly slower than production builds, and StrictMode double-invokes many functions in development. Numbers from a dev build are useful for relative comparisons between components, but not for absolute performance claims.
Fix: For any timing number you intend to act on, measure against a production build served locally or on a preview environment. The relative ordering of expensive components is usually consistent between dev and prod, but the absolute milliseconds are not.
A Verification Loop
Setup is only half the work. A useful loop looks like this:
- Add a boundary around the component you suspect.
- Record a baseline in a production build under a repeatable interaction (a scripted click sequence or a fixed scroll pattern works better than ad-hoc clicking).
- Make one change — stabilize a prop with
useCallback, split a component, move state down. - Re-record the same interaction and compare
actualDurationfor the sameidandphase. - Keep the change only if the number moved in the direction you expected and the interaction still behaves correctly.
Without step 2 and step 4 being comparable, you are measuring noise. A single reading before and a single reading after is not enough to conclude anything; run each a few times and look at the spread.
Trade-offs and When Not to Use the Profiler API
The Profiler API is a good fit for:
- Investigating a specific component after the DevTools Profiler has already flagged it.
- Instrumenting a preview environment so real interactions produce numbers you can aggregate.
- Writing tests that fail if a component’s render cost crosses a threshold you care about.
It is a poor fit for:
- General performance auditing across an unfamiliar codebase. Start with the DevTools Profiler or a browser trace instead; the API expects you to already know where to look.
- Production monitoring without a deliberate plan for the data. An
onRendercallback that logs toconsole.login production is noise; one that reports aggregated percentiles to a metrics system can be useful, but it needs the same care as any other telemetry. - Measuring anything other than React’s render phase. Network, layout, paint, and effect timing all live outside its scope.
One more caveat worth stating plainly: actualDuration is affected by which components happen to be memoized and by what the browser is doing at that moment. Two consecutive renders of the same component can differ by a wide margin if the machine is under load. Treat the numbers as directional, gather several samples, and compare like-for-like interactions rather than reading a single value as gospel.
A Short Reference
| Question | Where to look |
|---|---|
| How long did this subtree take to render this commit? | actualDuration from the Profiler API |
| How expensive would this subtree be without memoization? | baseDuration |
| Which components rendered in this commit? | React DevTools Profiler flame chart |
| Why is the page slow after render? | Browser Performance panel, not the Profiler API |
| Do dev numbers match prod? | No, and they aren’t meant to |
The Profiler API rewards a narrow question. Ask it something specific — “how much does this list cost on each keystroke” — and it gives a clean, loggable answer. Ask it something broad and you get a wall of callbacks that is harder to read than the visual tool you probably already had open.
Related guides: Common Mistakes When Optimizing React Forms for Performance, Building a PWA Caching Strategy for React Performance: The Service Worker That Cut Our Load Times, and Building a Performance-First React Component Library from Scratch.
🔗 Recommended Reading
- React Performance Mistakes in Fintech Dashboards and How to Fix Them
- Lazy Loading Images and Components in React: A Step-by-Step Tutorial
- React Memoization: When and How to Use memo, useMemo, and useCallback
- Next.js App Router Performance Optimization for Beginners: A Step-by-Step Guide
- Measuring and Fixing React Re-render Performance: A Step-by-Step Walkthrough