After reading this post, you will be able to produce React DevTools Profiler recordings that reflect your application’s real runtime behavior, diagnose the seven setup and interpretation errors that invalidate profiling data, and confidently determine whether a performance problem is worth fixing or is an artifact of how you measured it.
Profiling React applications is like taking blood pressure readings: if the cuff is placed wrong or the patient just ran a sprint, the numbers tell you nothing useful. React DevTools Profiler is a powerful tool, but its output becomes misleading the moment you violate one of its implicit assumptions in your setup or your reading of the data. This guide walks through the most common failure modes in order of how frequently they corrupt real profiling sessions, from the first click on the record button to the final interpretation of a flamegraph.
Step 1: Understanding What the Profiler Measures
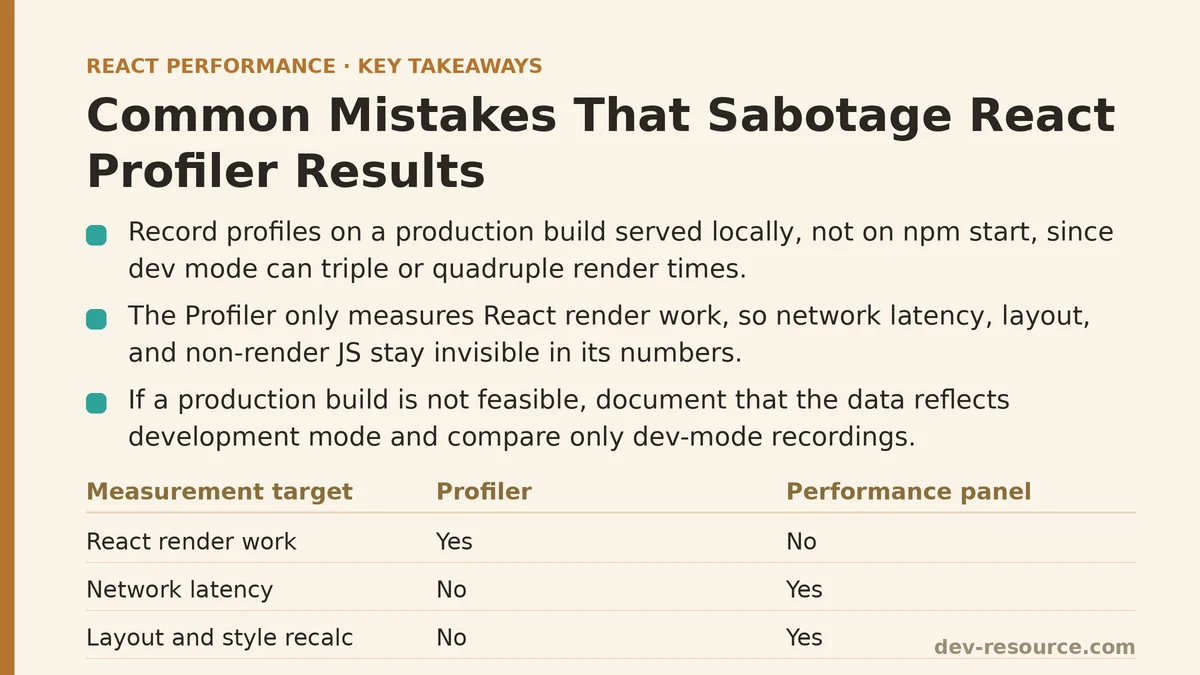
Before you can avoid sabotaging your results, you need to separate what the Profiler measures from what it does not. The Profiler records the time your React components spend rendering — executing the component functions, processing hooks, reconciling props, and committing changes to the DOM. It does not measure network latency, browser layout, style recalculations, or JavaScript work happening outside React’s render phase.
This distinction causes the first round of invalid conclusions. A component that fetches data inside useEffect will appear fast in the Profiler because effect execution is not part of the measured render time. A setState call triggered by a click will show as a render spike, but the work done inside the event handler before that call — parsing JSON, iterating arrays, manipulating the DOM directly — will be invisible to the Profiler.
To profile correctly, verify you are measuring React render work specifically. If your problem involves a blocking network request or heavy computation outside render, the Profiler is the wrong instrument entirely. Use the Performance panel in browser DevTools for that scope.
Step 2: Recording in Development Mode Instead of Production Build
The single most common setup error is hitting record while running npm start — a development server — and then treating the resulting flamegraph as representative of production performance. Development mode performs extensive additional checks and tree-walking that can measurably triple or quadruple render times. Components that show as slow in development may be perfectly fine in production, and the reverse: an optimization that shows no benefit in development might reveal a substantial improvement when measured against a production build.
The fix is straightforward. Build your app in production mode and serve that build while profiling. For a standard Vite or Create React App setup:
# Build and preview (Vite)
npm run build
npm run preview

# Or serve the build folder with a static server
npx serve build
Then open the production URL, open React DevTools, and record. The exact numbers you see will still be higher than a real user’s because of the DevTools overhead itself, but the relative comparison between components and the shape of your flamegraph will align with what you would see in the wild.
If a production build is not feasible during your profiling session — for example, because you need debug logging enabled — then add a two-line note to your findings documenting that the data reflects development mode. Compare numbers only against other development-mode recordings, never against production numbers.
Step 3: Profiling in a Simulated or Throttled Environment Without Declaring It
React Profiler recordings are portable across the browser regardless of device. This leads to a common trap: profiling on a powerful desktop machine and drawing conclusions about mobile performance. The Profiler measures JavaScript execution time, which is CPU-bound. If your desktop’s CPU is twice as fast as a mid-range phone’s, every component you see as “fast” in the Profiler may be borderline or slow on the target device.
The correct approach is to throttle the CPU to match your target environment before recording. Chrome DevTools supports this directly:
// Run this in the DevTools console (Chrome)
// or use the Performance panel settings
// to set CPU throttling to 4x or 6x slowdown.
In Chrome, open DevTools → Performance → Settings (gear icon), then set CPU throttling. Choose 4x or 6x slowdown — these roughly correspond to a mid-range Android device and a low-end device, respectively — and record the React Profiler with that throttling active.
If you are profiling locally for habit, your data will consistently understate the work involved on real hardware. Declare the throttling level in your profiling notes so you can compare across sessions. Without throttling, every optimization you test will look better than it is for your users.
Step 4: Recording Too Short a Window or Missing the Specific Interaction
React DevTools Profiler records a continuous time window. If you click record, interact for 1.5 seconds, then stop, the flamegraph will show only a handful of render commits. The Profiler’s commit timeline at the top of its panel shows each render as a bar. A common mistake is treating a single bar — the render triggered by one click — as statistically meaningful.
React render performance varies significantly depending on the state of the application, the browser’s background tasks, and garbage collection cycles taking place during that exact moment. A single commit lasting 18 milliseconds might be an outlier caused by a JIT compilation pause, not the typical cost of that update.
The reliable technique is to record for at least 5 to 10 seconds and trigger the interaction you care about three to five times. Scroll, click, type, navigate — whatever the user flow is, reproduce it several times within the same recording. Then read the commit bars, observe the minimum and maximum times, and look for a consistent cluster rather than one isolated spike.
| Recording duration | Number of interactions | Data quality |
|---|---|---|
| 1–2 seconds | 1 | Inadequate for conclusions |
| 5–10 seconds | 3–5 | Suitable for confident comparisons |
| 20+ seconds | 10+ | Robust for identifying flaky vs. consistent performance |
Step 5: Failing to Isolate the Component Tree Under Measurement
The Profiler flamegraph shows the render duration of every component that executed during the recording. You might identify that LargeList takes 45 milliseconds to render. You change a prop and re-profile, and now it takes 48 milliseconds. You conclude your change made it worse. But the increase could easily come from a sibling component that also re-rendered due to context changes, not from LargeList itself.
When measuring the effect of a single optimization, you must isolate that component from other sources of variance. Two practical approaches work well in testing.
First, use the Profiler’s built-in component filtering. In the Profiler panel, clear the “View all” filter and select the specific component you are measuring by name. The flamegraph now shows only that component’s commits, removing sibling noise from your visual analysis.
Second, reduce the scope of the update you are testing. Create a minimal reproduction in a separate route or page that renders only the component tree you are profiling, eliminating unrelated re-renders from layout, modals, or global state. This “lab environment” allows you to measure the component in isolation, then you can validate the finding in the full application afterward to confirm the fix holds.
For state-level changes, verify you are not accidentally profiling a render triggered by context prop changes that happen on the parent. The Profiler’s “ranked” view groups commits by total time. If your target component appears in every render, your isolation is good. If it appears intermittently, you are measuring a different interaction than you think.
Step 6: Misreading the Flamegraph — Interpreting Self vs. Total Time
The Profiler’s flamegraph shows two time values for each component: self duration and total duration. Self duration is the time spent inside the component function itself, excluding its children. Total duration includes every descendant component’s render time. A common mistake is reading total duration and attributing it to the component, causing you to “optimize” a component whose children do the heavy lifting.
When you see a parent component with a large total duration, the fix lies in the component’s children or in the way the parent re-renders those children. When you see a high self duration, the cost is inside the parent’s own logic — expensive computations, large array constructions, or heavy hook calls inside the function body.
Take this simple pattern:
function Parent() {
  const items = useMemo(() =>
    Array.from({ length: 2000 }, (_, i) => ({
      id: i,
      label: `Item ${i}`,
      complexField: computeExpensiveValue(i),
    })),
  []);

  return (
    <div>
      {items.map(item => <Child key={item.id} item={item} />)}
    </div>
  );
}

function Child({ item }) {
  // A long string of JSX or sub-components
  return <div>{item.label}</div>;
}
In the Profiler, Parent’s total duration will be large because it includes 2000 children. Its self duration will be small unless the useMemo is missing or the array construction is expensive. The correct conclusion is that the performance issue is in the count of children plus the per-child render cost in Child, not in Parent’s own logic.
To act on this reading, check each child component’s self time in the flamegraph. If one child’s self time dominates, optimize that child. If all children have similar self times, the problem is the sheer number of them — you may need windowing (react-window or react-virtualized) or memoization with stable props.
Step 7: Comparing Recordings Without Controlling for External Conditions
Garbage collection, JIT compiler warm-up, and even open browser tabs consuming CPU can shift Profiler numbers by 10–20%, undermining before-and-after comparisons. You can draw a confident, meaningful conclusion from two recordings only if you control for these external conditions.
The technique is to take a baseline recording, apply your change, and then re-record under identical conditions: same page, same throttling, same five interactions, same time of day on the same machine. Additionally, do what is called a “warm-up pass.” Before recording the baseline, interact with the page for a few seconds to let React, the JIT, and the browser settle into steady state. Then take three recordings per configuration and compare the median commit times, not the fastest or the slowest outliers.
If a change improves the median render time from 30ms to 20ms but one of the three recordings shows 28ms, do not dismiss the change as noise. Look at the commit timeline bars to determine whether the outlier corresponds to a different code path (e.g., the first render of a modal) or a GC pause. The median of three stable recordings gives you far more signal than a single dramatic screenshot.
The End-to-End Profiling Checklist
Here is the exact sequence to follow every time you profile a React app, assembling the steps above into one workflow.
- Target the production build. Serve the built assets, not the dev server.
- Set your throttling level. Match it to your real user’s hardware (e.g., 4x CPU slowdown for mobile).
- Navigate to the page and interact with it for 5 seconds before recording — this is the warm-up.
- Click record, then trigger the exact interaction you care about 3–5 times across a 10-second window.
- Stop recording. Look at the commit timeline bars. Ignore the first commit if it appears immediately after record was clicked (that is often a layout effect or state reset from DevTools).
- Isolate the component you are evaluating using the filter in the Profiler panel.
- Read the flamegraph, separating self time from total time.
- If comparing before/after, apply your change, repeat steps 3–6, and compare the median of three separate recordings.
- Log your conditions — production or dev, throttling level, machine, browser version, and the interactions you used. Add this as a comment or a Markdown note in your codebase so the next developer running your profiler knows what to replicate.
This checklist is the difference between profiling being a debugging crutch and being a reliable engineering tool. In practice, most performance work requires dozens of iterations between hypothesis and measurement. Cutting the measurement corruption early turns each iteration into useful signal rather than a coin flip.
When you profile with this sequence, the numbers you get will match the experience of your real users. That alignment is what makes the Profiler a trustworthy guide — not beautiful flamegraphs, but reproducible measurements taken in conditions that resemble your users’ actual runtime.
Which of these mistakes have you run into when profiling your React app? If your recorded flamegraphs look confusing or inconsistent after applying the checklist above, describe the component tree you are measuring and I can help you interpret the data.
Related guides: How to Use React DevTools Profiler to Find Real Bottlenecks, React Memory Leaks: Common Causes and Fixes, and Measuring and Fixing React Re-render Performance: A Step-by-Step Walkthrough.
🔗 Recommended Reading
- React Render Props Performance: A Beginner Tutorial
- React Performance Mistakes in Fintech Dashboards and How to Fix Them
- Lazy Loading Images and Components in React: A Step-by-Step Tutorial
- React Memoization: When and How to Use memo, useMemo, and useCallback
- Next.js App Router Performance Optimization for Beginners: A Step-by-Step Guide