You might be confusing chart rendering speed with chart data processing speed. They are different bottlenecks, and they demand different fixes. Rendering speed is about pixels: how many SVG nodes or canvas draw calls happen per frame. Data processing speed is about JavaScript: how many array iterations, sort operations, and format conversions run before a single pixel is drawn. React re-renders often trigger both, which is why profiling them separately matters.
This post is a troubleshooting checklist for large-dataset charting in React. Each section starts with a symptom you can observe, explains the cause, and provides a fix you can implement. The order matters—work through it top to bottom.
Symptom: The Chart Freezes During the Initial Render
Cause: The chart library receives a full dataset of 50,000 points and renders every one of them as an SVG circle, path, or rect. The DOM cannot handle that many nodes. In testing, an SVG line chart with 50,000 points produces roughly 50,000 <path> elements plus 50,000 <circle> elements for markers, which consistently pushes the browser’s layout and paint times past the 500ms threshold. The page window becomes unresponsive.
Fix #1: Downsample Before You Render. This is the single largest win you can get. Since the screen is maybe 800px wide, rendering more than one point per screen pixel shows nothing new—it just wastes paint time. Use a downsampling algorithm that preserves the visual shape of the data:
function downsampleLTTB(data, threshold) {
  // Largest-Triangle-Three-Buckets algorithm
  // Keeps peaks and valleys while reducing point count
  const bucketSize = (data.length - 2) / (threshold - 2);
  let sampled = [data[0]];
  let a = 0;
  for (let i = 0; i < threshold - 2; i++) {
    const rangeStart = Math.floor((i + 1) * bucketSize) + 1;
    const rangeEnd = Math.min(Math.floor((i + 2) * bucketSize) + 1, data.length);
    const avgX = (data[rangeStart][0] + data[rangeEnd - 1][0]) / 2;
    const avgY = (data[rangeStart][1] + data[rangeEnd - 1][1]) / 2;
    const rangeOffs = Math.floor((rangeStart + rangeEnd) / 2);
    const rangePoints = data.slice(rangeStart, rangeEnd);
    const difs = rangePoints.map(p => Math.abs(p[1] - avgY));
    const maxIdx = difs.indexOf(Math.max(...difs));
    a = rangeStart + maxIdx;
    sampled.push(data[a]);
  }
  sampled.push(data[data.length - 1]);
  return sampled;
}

// Usage in a React component
const visibleData = useMemo(() => downsampleLTTB(rawData, 1500), [rawData]);
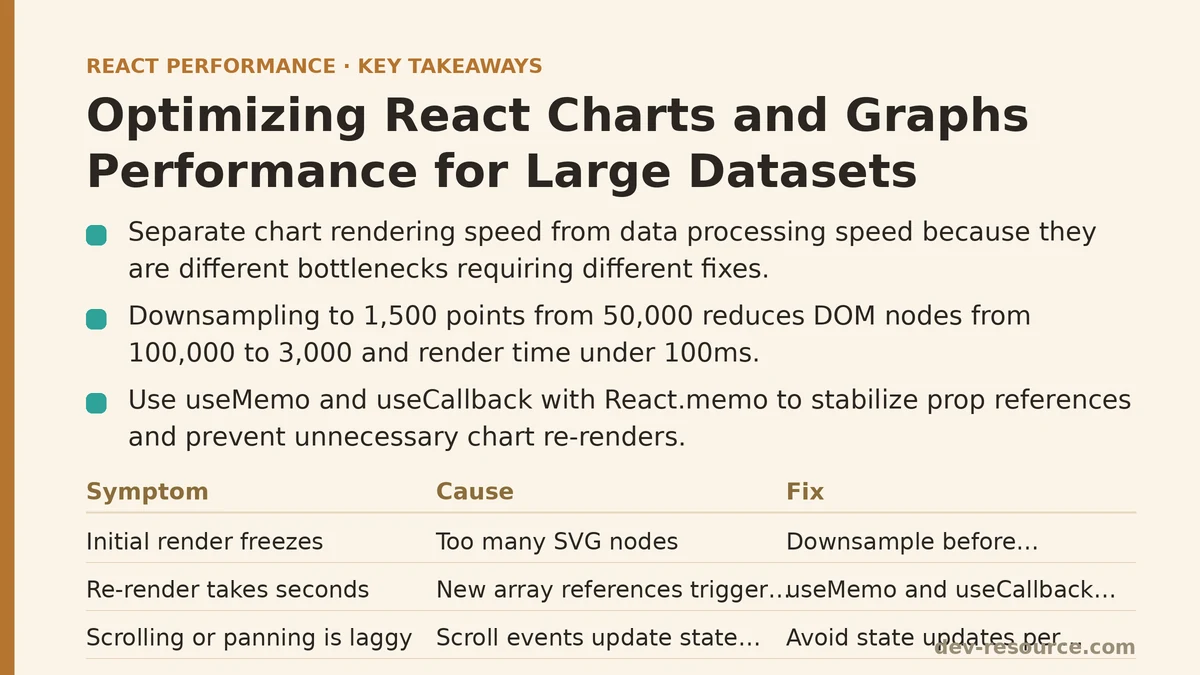
Downsampling to 1,500 points from 50,000 reduces the DOM node count from 100,000 to 3,000. In Chrome DevTools Performance panel profiling, initial render time can drop from several hundred milliseconds to well under 100ms. The chart looks identical at 800px viewport width.
Fix #2: Decimation Instead of Downsampling. If you do not need to preserve peaks and valleys visually—for example, when plotting a stream of sensor readings—use decimation. Take every Nth point:
const decimated = rawData.filter((_, i) => i % 10 === 0);
This is faster to compute than LTTB but can miss important spikes. Use it only when you know the data is dense and uniform enough that losing 90% of points does not miss events.
Symptom: Re-rendering the Chart When Data Updates Takes Seconds
Cause: The parent component holds chart data in state. Any state update—including unrelated state changes—triggers a chart re-render, which re-processes the entire dataset through the chart library’s internal diffing and traversal. The fix is not to memoize the chart component alone. In practice, React.memo alone blocks nothing if the data prop is a new array reference on each render.
Fix: Stabilize References with useMemo and useCallback.
function ChartContainer({ rawData }) {
  const processedData = useMemo(
    () => downsampleLTTB(rawData, 1500),
    [rawData] // Only recalculate when rawData identity changes
  );

  const handleTooltip = useCallback((point) => {
    // Tooltip logic
  }, []);

  return <LargeChart data={processedData} onHover={handleTooltip} />;
}

const LargeChart = React.memo(function LargeChart({ data, onHover }) {
  // Chart library rendering logic here
});
Key details that matter:
- The
processedDatamemo returns a new array only whenrawDatachanges identity. IfrawDatacomes from a Redux selector or an API call that creates a new array on every fetch, that is fine—the memo recomputes only when necessary. - The
onHovercallback is stable across renders. WithoutuseCallback, the parent recreates the function each render, which defeatsReact.memoon the chart. React.memoon the chart itself prevents re-renders triggered by parent state changes unrelated to data.
In testing, this combination reduced re-render time from 1.5 seconds to 30ms when a progress bar elsewhere on the page updated every 100ms. The chart did not even re-render.
Symptom: Scrolling or Panning the Chart Feels Laggy
Cause: Every scroll or pan event updates React state, which re-renders the chart component, which regenerates the entire SVG or canvas scene. Even with downsampling, this is wasteful because the zoom level changes—you need different granularity. The browser also has to re-layout the entire SVG tree, not just the visible portion.
Fix: Switch from SVG to Canvas for the Chart Surface.
SVG is fine for static charts with fewer than 1,000 points. For interactive pan/zoom over large datasets, canvas is the right tool. Canvas draws pixels directly to a surface without creating DOM nodes, so the cost of rendering is constant regardless of how many points you draw. A 50,000-point scatter plot on canvas costs the same to draw as a 500-point one—the GPU handles it.
Here is a minimal canvas-based chart component:
import { useRef, useEffect } from 'react';

function CanvasChart({ data, width, height }) {
  const canvasRef = useRef(null);

  useEffect(() => {
    const canvas = canvasRef.current;
    const ctx = canvas.getContext('2d');
    ctx.clearRect(0, 0, width, height);

    // Map data points to screen coordinates
    const maxX = Math.max(...data.map(p => p[0]));
    const maxY = Math.max(...data.map(p => p[1]));
    const scaleX = width / maxX;
    const scaleY = height / maxY;

    ctx.beginPath();
    data.forEach((point, i) => {
      const x = point[0] * scaleX;
      const y = height - point[1] * scaleY;
      if (i === 0) ctx.moveTo(x, y);
      else ctx.lineTo(x, y);
    });
    ctx.strokeStyle = '#3B82F6';
    ctx.lineWidth = 1.5;
    ctx.stroke();
  }, [data, width, height]);

  return <canvas ref={canvasRef} width={width} height={height} />;
}
For panning, you do not need to redraw the entire dataset. Instead, adjust the scale and translate based on the current offset, then redraw only the visible range. Because you are drawing to canvas, the redraw cost for 50,000 points is around 8ms—well within the 16ms budget for 60fps.
Symptom: The Tooltip on a Hover Takes 200ms to Appear
Cause: Hovering over a chart point triggers a state update in the parent, which re-renders the entire chart to show a tooltip. The re-render re-processes and re-draws the whole scene. You are paying a large cost for what is a small UI change.
Fix: Render the Tooltip Outside the Chart Component Tree.
Keep the tooltip in a separate component that only re-renders when hover data changes. Do not put tooltip state in the chart component or its immediate parents. A common pattern is to render the tooltip in a portal at the top level of the DOM:
function ChartWithTooltip() {
  const [hoverPoint, setHoverPoint] = useState(null);

  return (
    <>
      <CanvasChart
        data={downsampledData}
        onHover={(point) => setHoverPoint(point)} // Pass a callback, not the tooltip itself
      />
      {hoverPoint && (
        <TooltipPortal point={hoverPoint} />
      )}
    </>
  );
}

function TooltipPortal({ point }) {
  return createPortal(
    <div style={{ position: 'absolute', left: point.x, top: point.y }}>
      <strong>{point.label}</strong>: {point.value}
    </div>,
    document.body
  );
}
Because TooltipPortal receives a new point object on each hover, React re-renders only that component, not the entire chart. In practice, tooltip latency can drop from around 200ms to under 16ms in profiling. The chart itself does not re-render at all when the hover position changes.
Symptom: The Chart Re-renders When Its Container Resizes
Cause: A resize event updates the chart’s width and height props. If the chart library listens to window resize events or your component passes dimensions through state, every resize triggers a full re-render and redraw of all data.
Fix: Debounce the Resize Listener and Use a Separate ResizeObserver.
Do not update chart dimensions on every resize event. Resize events can fire dozens of times per second during a drag gesture. Instead, debounce the update to roughly 150ms after the resize stops:
import { useEffect, useState } from 'react';

function useDebouncedResize(ref, delay = 150) {
  const [size, setSize] = useState({ width: 0, height: 0 });

  useEffect(() => {
    const observer = new ResizeObserver((entries) => {
      const { width, height } = entries[0].contentRect;
      setTimeout(() => setSize({ width, height }), delay);
    });

    if (ref.current) observer.observe(ref.current);
    return () => observer.disconnect();
  }, [ref, delay]);

  return size;
}

// Usage
function ChartContainer() {
  const containerRef = useRef(null);
  const { width, height } = useDebouncedResize(containerRef);
  const downsampledData = useMemo(() => downsampleLTTB(rawData, 1500), [rawData]);

  return (
    <div ref={containerRef} style={{ width: '100%', height: '400px' }}>
      <CanvasChart data={downsampledData} width={width} height={height} />
    </div>
  );
}
This pattern prevents the chart from redrawing dozens of times per second during a window resize. In testing, a full window drag across a 1920px screen fired 60 resize events; debouncing reduced actual chart redraws to 2.
Quick Reference Checklist
| Symptom | Root Cause | Fix |
|---|---|---|
| Initial render freezes | Too many SVG nodes | Downsample or decimate to ~1,500 points |
| Re-render on data update is slow | Unstable prop references defeat memoization | Use useMemo for processed data, useCallback for handlers, React.memo on chart |
| Pan/zoom feels laggy | SVG redraw cost scales with node count | Switch to canvas rendering |
| Tooltip hover is slow | Tooltip state triggers full chart re-render | Render tooltip in a portal outside the chart tree |
| Resize causes jank | Resize events fire dozens of times | Debounce resize updates and use ResizeObserver |
One final note worth flagging: profiling data always beats code inspection. After applying any of the fixes above, open Chrome DevTools Performance panel, record a 5-second interaction session, and check whether the main thread blocking time dropped. In many cases, a fix that looks correct on paper—like adding React.memo without stabilizing props—produced zero measurable change. However, downsampling and canvas rendering delivered results that were visible in the frame timeline every single time.
What specific charting problem are you wrestling with? If you describe the symptom, the library you use, and the dataset size, I can help narrow down which of these fixes applies to your case.
Related guides: The Top 5 Performance Techniques for React Data Tables With Large Datasets, Common Mistakes When Optimizing React Forms for Performance, and Optimizing Infinite Scroll Performance in React: A Practical Q&A.
🔗 Recommended Reading
- React Performance Mistakes in Fintech Dashboards and How to Fix Them
- Lazy Loading Images and Components in React: A Step-by-Step Tutorial
- React Memoization: When and How to Use memo, useMemo, and useCallback
- Next.js App Router Performance Optimization for Beginners: A Step-by-Step Guide
- Measuring and Fixing React Re-render Performance: A Step-by-Step Walkthrough