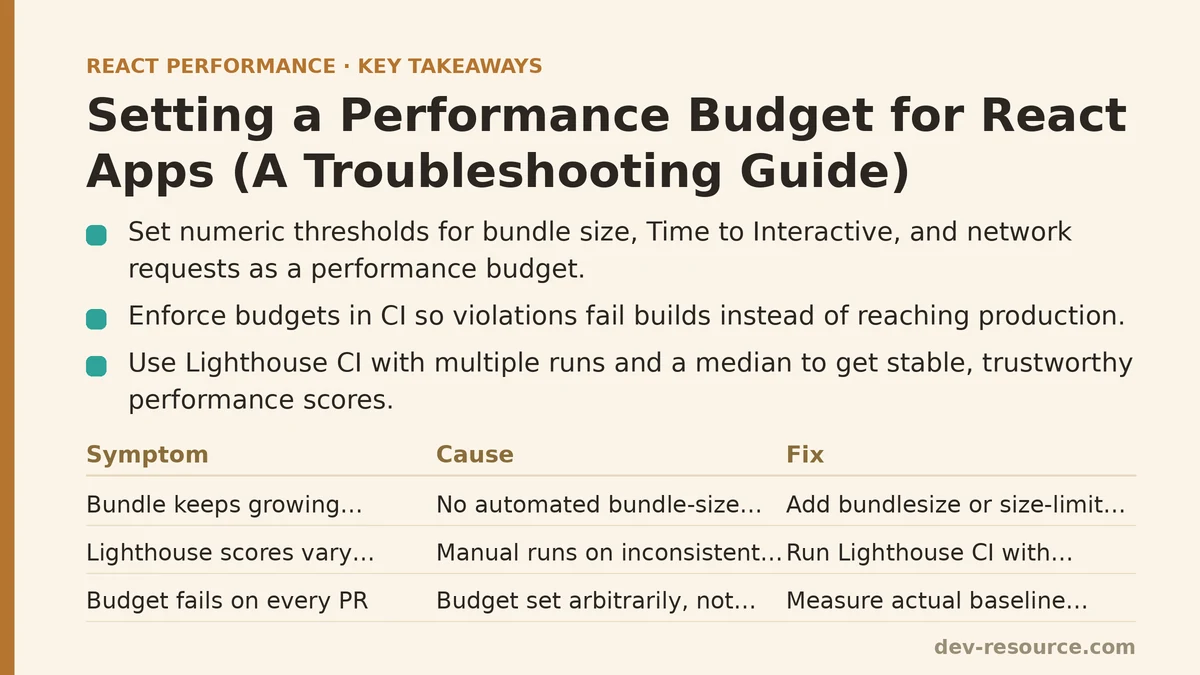
After reading this, you’ll be able to set concrete numeric limits on bundle size and load timing for a React app, wire those limits into your build pipeline so violations fail a CI check rather than reach production, and diagnose the most common reasons a budget gets breached in the first place. A performance budget only works if it’s enforced automatically — a number in a wiki page that nobody checks isn’t a budget, it’s a wish. What follows is organized as a troubleshooting reference: a symptom you might already be seeing, the underlying cause, and the fix.
What a Performance Budget Actually Is
A performance budget is a set of numeric thresholds — bundle size in kilobytes, Time to Interactive in seconds, number of network requests on first load — that a build is not allowed to exceed. It’s the difference between “we should keep things fast” and “the CI job fails if the main bundle exceeds 180 KB gzipped.” The first is a hope. The second is a rule with teeth.
Most teams that skip this step don’t do so on purpose. Performance regresses a few kilobytes at a time, one dependency addition or one unmemoized component at a time, until eighteen months later the app is twice as heavy as it started and nobody can point to the single commit responsible. A budget catches that drift while it’s still a few kilobytes, not after it compounds.
Symptom: The Bundle Keeps Growing and Nobody Notices Until Users Complain
Cause: There is no automated check comparing bundle size across commits, so size increases slip through code review unnoticed. A reviewer glancing at a pull request rarely calculates the gzipped weight of a new dependency by eye.
Fix: Add a bundle-size check to CI using a tool built for exactly this — bundlesize or the newer size-limit package are both common choices. Configure a hard ceiling per bundle and let the build fail when it’s crossed.
{
  "size-limit": [
    {
      "path": "build/static/js/main.*.js",
      "limit": "180 KB"
    }
  ]
}
Running npx size-limit in a CI step turns this from a suggestion into a gate. A pull request that pushes the main bundle to 195 KB fails the build, and the diff makes clear exactly which dependency or code change caused the jump. This is the single highest-leverage fix on this list — most budget violations get caught here before they reach any other stage.
Symptom: Lighthouse Scores Vary Wildly Between Runs, So Nobody Trusts the Number
Cause: Lighthouse run manually, once, on a developer’s laptop with an unpredictable network condition and background CPU load, produces noisy results that swing by ten or more points between runs. Teams that rely on this method tend to stop checking altogether once they notice the inconsistency.
Fix: Run Lighthouse in CI using Lighthouse CI (@lhci/cli), which runs multiple passes automatically and reports a median, against a fixed configuration and a fixed simulated network throttle. Set assertions directly in the config so a run below threshold fails the build rather than just producing a report someone has to remember to read.
// lighthouserc.js
module.exports = {
  ci: {
    collect: {
      numberOfRuns: 3,
    },
    assert: {
      assertions: {
        'largest-contentful-paint': ['error', { maxNumericValue: 2500 }],
        'total-blocking-time': ['error', { maxNumericValue: 300 }],
        'categories:performance': ['error', { minScore: 0.9 }],
      },
    },
  },
};
Three runs and a median is enough to smooth out most of the noise from a single-pass measurement, and it turns LCP and Total Blocking Time into gates rather than trivia.
Symptom: The Budget Fails on Every Pull Request, Including Ones That Don’t Touch Performance-Sensitive Code
Cause: The budget was set arbitrarily — copied from a blog post, or picked as a round number — without measuring the app’s actual baseline first. A budget tighter than what the current architecture can realistically hit turns every single build red, which trains the team to ignore the failure entirely.
Fix: Measure the current, honest baseline before setting any limit. Run the bundle analyzer, note the real current size, and set the initial budget slightly above that — tight enough to catch regressions, loose enough to pass today’s code.
npx webpack-bundle-analyzer build/static/js/main.*.js
A reasonable starting budget is the current measured value plus a 10–15% buffer, not an aspirational target borrowed from a different codebase with a different feature set. Tighten it gradually, in small increments, as the team actively works down the baseline — not in one aggressive jump that immediately starts failing builds again.
Symptom: The Bundle Size Is Fine, But Time to Interactive Is Still Slow
Cause: A budget focused only on total bundle size misses a common failure mode: a small bundle that still blocks the main thread for a long stretch, usually because of expensive synchronous work during initial render — large unmemoized computations, blocking third-party scripts, or a router that eagerly imports every route instead of splitting them.
Fix: Track Total Blocking Time and Time to Interactive as separate budget line items, not as implied consequences of bundle size. Route-based code splitting with React.lazy is the most common fix for this specific symptom:
const Dashboard = React.lazy(() => import('./Dashboard'));

function App() {
  return (
    <Suspense fallback={<LoadingSpinner />}>
      <Dashboard />
    </Suspense>
  );
}
Splitting rarely-visited routes out of the main bundle reduces the JavaScript the browser must parse and execute before the page becomes interactive, even when the total shipped code across the whole app stays the same or grows slightly.
Symptom: A Third-Party Script Blew Past the Budget and Nobody on the Team Added It Directly
Cause: Analytics tags, chat widgets, and A/B testing scripts get added through a tag manager or a marketing team’s request, bypassing the pull-request review process entirely — and therefore bypassing the CI budget check too, since nothing in the codebase changed.
Fix: Budget checks that only run against the built JavaScript bundle won’t catch scripts injected at runtime through a tag manager. Extend the Lighthouse CI check to run against the deployed staging environment, not just the local build output, so third-party scripts are included in the measurement. Pair this with a <link rel="preconnect"> or async loading requirement for any new third-party tag, agreed on before it’s added rather than discovered after a budget regression.
Symptom: The Budget Passes in CI But Users on Real Devices Still Report Slowness
Cause: Lab data — Lighthouse, WebPageTest, a CI run — measures a controlled environment that doesn’t reflect the range of devices and network conditions real users bring. A mid-tier Android phone on a throttled connection can miss the budget by a wide margin even when every CI check is green.
Fix: Pair the lab-based budget with field data collected through the Chrome User Experience Report (CrUX) or a real-user-monitoring tool such as web-vitals reporting to an analytics endpoint. Lab checks catch regressions before deploy; field data confirms whether the budget set in the lab actually holds up across the real distribution of devices your users have.
import { onLCP, onINP, onCLS } from 'web-vitals';

onLCP(metric => sendToAnalytics('LCP', metric.value));
onINP(metric => sendToAnalytics('INP', metric.value));
onCLS(metric => sendToAnalytics('CLS', metric.value));
If field data consistently shows LCP well above the lab budget’s threshold, the lab configuration is under-simulating real conditions — usually the network throttle setting or the device CPU throttle — and needs to be adjusted to match.
A Starting Budget Worth Copying
For a typical mid-sized React app with no unusual media or third-party requirements, this is a reasonable starting point — tune it against your own measured baseline rather than adopting it blindly:
| Metric | Suggested Budget |
|---|---|
| Main JS bundle (gzipped) | 170–200 KB |
| Total JS on initial load | 300–350 KB |
| Largest Contentful Paint | ≤ 2.5s |
| Total Blocking Time | ≤ 300ms |
| Cumulative Layout Shift | ≤ 0.1 |
| Lighthouse Performance Score | ≥ 90 |
None of these numbers matter without the CI enforcement covered above. A budget that lives only in a document is a target; a budget wired into a failing build is a guarantee.
What does your current CI pipeline check on every pull request — and is bundle size one of them yet?
Related guides: Automated Performance Regression Testing for React: A Practical Setup Guide, Improving Largest Contentful Paint (LCP) in React Apps: A Beginner vs Advanced Guide, and Building a Performance-First React Component Library from Scratch.
🔗 Recommended Reading
- React Performance Mistakes in Fintech Dashboards and How to Fix Them
- Lazy Loading Images and Components in React: A Step-by-Step Tutorial
- React Memoization: When and How to Use memo, useMemo, and useCallback
- Next.js App Router Performance Optimization for Beginners: A Step-by-Step Guide
- Measuring and Fixing React Re-render Performance: A Step-by-Step Walkthrough