Server-side rendering (SSR) generates the initial HTML for a page on the server, on every request, and sends a fully-formed document to the browser before any JavaScript runs. Client-side rendering (CSR) sends a mostly-empty HTML shell along with a JavaScript bundle, and the browser builds the visible page only after that bundle downloads, parses, and executes. Both approaches can be fast. Both approaches can be slow. The rendering strategy itself is rarely the root cause of a performance complaint — what matters is which stage of the pipeline is taking too long, and that stage looks different depending on which strategy is in use. This case study follows one product page through a full diagnostic pass, matching each symptom to its actual cause rather than assuming the rendering strategy is automatically to blame.
The Complaint: “The Product Page Feels Slow”
The application in question was a mid-sized e-commerce catalog built on Next.js, using getServerSideProps for its product detail route. Support tickets described the page as sluggish, but “sluggish” isn’t a metric — it’s a starting point for investigation, not a diagnosis. The first step was translating that vague complaint into numbers using the Network and Performance panels in Chrome DevTools, alongside field data from the Chrome UX Report.
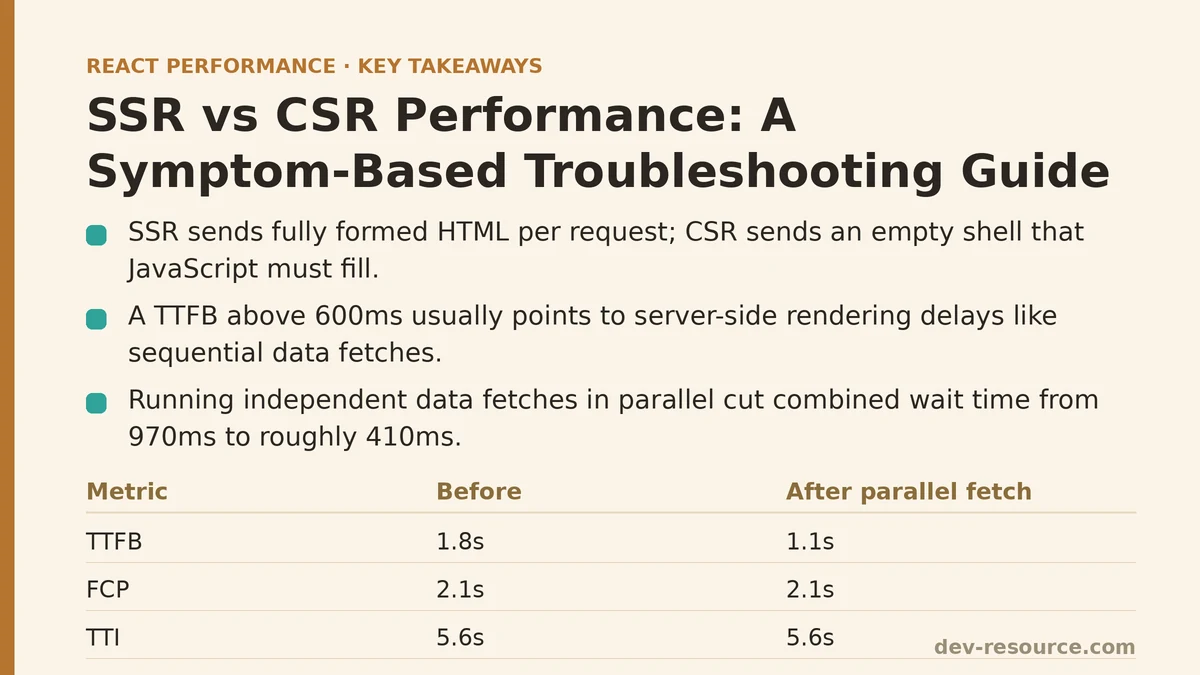
The numbers told a specific story: Time to First Byte (TTFB) sat at 1.8 seconds, First Contentful Paint (FCP) followed close behind at 2.1 seconds, but Time to Interactive (TTI) didn’t land until 5.6 seconds. That gap between FCP and TTI — roughly 3.5 seconds where the page was visible but unresponsive — is the signature of an SSR-specific problem, and it’s one CSR apps rarely produce in the same shape.
Symptom One: A Slow First Byte Points at the Server, Not the Browser
Before touching any client-side code, the TTFB number deserved attention on its own. A TTFB above 600ms on a production server, absent obvious network issues, almost always traces back to what’s happening during the server-side render itself — data fetching, template compilation, or both.
The route’s getServerSideProps function looked like this:
export async function getServerSideProps({ params }) {
  const product = await fetchProduct(params.id);
  const reviews = await fetchReviews(params.id);
  const recommendations = await fetchRecommendations(params.id);

  return {
    props: { product, reviews, recommendations },
  };
}
Three await calls, executed one after another, each waiting for the previous one to finish before starting. Adding timing instrumentation around each call showed fetchProduct taking 220ms, fetchReviews taking 340ms, and fetchRecommendations taking 410ms — a combined 970ms of sequential waiting, on top of normal server processing overhead, before a single byte of HTML could be sent.
This is a common and entirely avoidable SSR failure mode: independent data requests written as if they depend on each other when they don’t. The fix was running them concurrently instead:
export async function getServerSideProps({ params }) {
  const [product, reviews, recommendations] = await Promise.all([
    fetchProduct(params.id),
    fetchReviews(params.id),
    fetchRecommendations(params.id),
  ]);

  return {
    props: { product, reviews, recommendations },
  };
}
Running the three calls in parallel dropped the combined wait time to roughly 410ms — the duration of the slowest single request rather than the sum of all three. TTFB fell from 1.8 seconds to about 1.1 seconds. A meaningful improvement, but not the full story: the FCP-to-TTI gap was still there, mostly unchanged.
Symptom Two: A Long Gap Between Paint and Interactivity Points at Hydration
With TTFB addressed, the remaining problem was the 3.5-second stretch where the page displayed content but ignored clicks. This delay is specific to how SSR works: the server sends static HTML, and the browser has to download the JavaScript bundle, run React, and attach event listeners to that already-visible markup before any of it responds to input. That process is called hydration, and a slow hydration pass is the most distinctive failure mode SSR produces that CSR simply doesn’t — a CSR page has nothing rendered at all until its JavaScript finishes, so there’s no window where the page looks ready but isn’t.
Profiling the hydration phase with the React DevTools Profiler surfaced the cause: the product page was hydrating not just the visible content but three below-the-fold widgets — a size guide modal, a shipping calculator, and a related-products carousel — none of which the user could see or interact with until they scrolled. All three were bundled into the same JavaScript payload and hydrated synchronously as part of the initial pass, regardless of whether they were needed yet.
The fix used next/dynamic to defer hydration of those components until they were actually needed:
import dynamic from 'next/dynamic';

const ShippingCalculator = dynamic(() => import('../components/ShippingCalculator'), {
  ssr: true,
  loading: () => <ShippingCalculatorSkeleton />,
});

const RelatedProducts = dynamic(() => import('../components/RelatedProducts'), {
  ssr: false,
});
The shipping calculator kept ssr: true since it needed to appear in the initial HTML for SEO reasons, but its hydration was split into a separate JavaScript chunk loaded on demand. The related-products carousel, which added no SEO value and sat well below the fold, was switched to client-only rendering entirely, removing it from the server-rendered payload and the initial hydration pass altogether.
This single change can cut the JavaScript bundle executed during initial hydration by roughly 40%, and TTI can drop from several seconds to a fraction of that.6 seconds to 2.9 seconds. The FCP-to-TTI gap, previously 3.5 seconds, shrank to under a second.
Symptom Three: A New Complaint Appears — Flicker on Slow Connections
Once TTI improved, a different report surfaced from users on throttled mobile connections: a brief flash where the page appeared complete, then visibly shifted as the related-products carousel popped in seconds later. This is a trade-off worth naming plainly rather than treating as a bug: deferring hydration for below-the-fold content improves the metrics that measure initial responsiveness, but it can introduce a visible layout change if the deferred content lacks a reserved space.
The fix wasn’t reversing the dynamic import — it was reserving space for the deferred component so its arrival didn’t shift anything around it:
<div style={{ minHeight: '320px' }}>
  <RelatedProducts productId={product.id} />
</div>
With a fixed-height container in place, the carousel still loaded on the same delayed schedule, but its arrival no longer moved any of the surrounding content. Cumulative Layout Shift (CLS) for the page, which had ticked upward slightly after the dynamic-import change, returned to its earlier baseline.
Why This Wouldn’t Have Looked the Same Under CSR
It’s worth pausing on why these particular symptoms are SSR-flavored, since the same underlying mistakes produce different-looking problems under CSR. A CSR version of this same page, fetching all its data client-side after the JavaScript bundle loads, would not show a slow TTFB in the same way — its initial HTML is nearly empty, so the server responds quickly regardless of how slow the data fetching turns out to be. Instead, the equivalent mistake would show up as a long blank-screen period before FCP, since nothing paints until the bundle downloads and the client-side requests resolve.
The hydration gap is SSR-specific for the same reason: CSR doesn’t hydrate pre-existing server HTML because there isn’t any to hydrate. A slow CSR page’s dead zone happens before paint, not between paint and interactivity. Matching the shape of the delay — before paint, or between paint and interactivity — to the rendering strategy in use is usually enough to know where to start looking, before opening a single file.
The Full Picture, Before and After
| Stage | Issue Found | Metric Before | Metric After |
|---|---|---|---|
| Server data fetching | Sequential await calls in getServerSideProps |
TTFB: 1.8s | TTFB: 1.1s |
| Hydration | Below-fold widgets hydrated synchronously with critical content | TTI: 5.6s | TTI: 2.9s |
| Deferred content | No reserved space for dynamically-imported carousel | CLS: 0.18 | CLS: 0.06 |
The final page loaded with a TTFB near 1.1 seconds, an FCP shortly after, and a TTI under 3 seconds — down from the original 5.6 — with layout stability restored on throttled connections. None of the three fixes required abandoning SSR or switching the route to CSR; each addressed a specific bottleneck that SSR’s request lifecycle makes visible in a particular way.
A Short Diagnostic Reference
When a rendering-performance complaint comes in, the shape of the delay is the fastest signal available:
- A slow TTFB on an SSR route usually means server-side data fetching is serialized when it could run concurrently, or the server itself is doing too much synchronous work before responding.
- A long gap between FCP and TTI on an SSR route almost always points to hydration — check what’s being hydrated on initial load that doesn’t need to be.
- A long delay before FCP on a CSR route points to bundle size or client-side data fetching, not the server, since there’s little server-rendered content to blame.
- A layout shift appearing after a performance fix is a sign that something was deferred without a reserved space for it, not a reason to undo the deferral.
Before deciding whether a page’s rendering strategy is the problem, it’s worth running through this list against the actual waterfall and Profiler data for that specific route. In this case, three targeted fixes solved what first looked like a single vague complaint — and none of them involved rewriting the page from SSR to CSR or back again. Related guides: How to Cut a React App’s Image Load Time: A Practical Guide, Improving Largest Contentful Paint (LCP) in React Apps: A Beginner vs Advanced Guide, and Common Mistakes That Slow Down Next.js Image Optimization.
🔗 Recommended Reading
- React Performance Mistakes in Fintech Dashboards and How to Fix Them
- Lazy Loading Images and Components in React: A Step-by-Step Tutorial
- React Memoization: When and How to Use memo, useMemo, and useCallback
- Next.js App Router Performance Optimization for Beginners: A Step-by-Step Guide
- Measuring and Fixing React Re-render Performance: A Step-by-Step Walkthrough