By the end of this post, you’ll be able to spot a request waterfall in a React application’s network panel, explain why useEffect-based fetching tends to produce one, and restructure the same code around Suspense so that independent requests fire together instead of in sequence. You’ll also know where to place Suspense boundaries so a slow request doesn’t block the parts of the page that are already ready to render.
The case study below is a single dashboard rebuild, but the pattern it exposes shows up in almost any React app that fetches data inside useEffect and renders conditionally on loading flags.
A Dashboard That Loaded One Panel at a Time
The application in question was an internal analytics dashboard: a page header, a summary metrics panel, a chart, and a table of recent events, all fed by four separate API endpoints. Opening the page showed a familiar sequence — the header appeared instantly, then a loading spinner for the metrics panel resolved, then the chart’s spinner resolved, then finally the table filled in. Each panel took roughly 300–400ms to load its own data, and the full page wasn’t interactive for close to 1.6 seconds even though none of the individual requests were slow on their own.
That sequencing is the tell. When four requests that don’t depend on each other still resolve one after another, the problem isn’t the backend. It’s almost always the shape of the fetching code on the frontend.
Tracing the Waterfall in the Network Panel
Opening the browser’s Network tab and reloading with cache disabled confirmed it directly: the four API calls weren’t overlapping. Each one started only after the previous component had finished rendering and its useEffect had fired. The requests were technically independent — none of them needed data from another — but the code had made them dependent on render order anyway.
This is the classic signature of components that fetch their own data on mount and only start that fetch once they’ve been rendered by a parent that is, itself, waiting on something else.
The Naive Pattern Behind the Waterfall
The dashboard’s components looked something like this, repeated with small variations across the four panels:
function MetricsPanel() {
  const [data, setData] = useState(null);
  const [loading, setLoading] = useState(true);

  useEffect(() => {
    fetchMetrics().then(result => {
      setData(result);
      setLoading(false);
    });
  }, []);

  if (loading) return <Spinner />;
  return <MetricsView data={data} />;
}
Each panel is a self-contained unit, which feels like good component design. The trouble is that React has to render MetricsPanel before its useEffect can run, and if MetricsPanel is nested inside a component tree that’s conditionally rendering based on another panel’s loading state — even loosely, through shared layout logic — the fetch for the second panel doesn’t start until the first has resolved. Multiply that across four panels and you get a staircase instead of a flat line in the network waterfall.
Introducing Suspense Boundaries Without Fixing the Real Problem
The first attempt at a fix reached for <Suspense> directly, wrapping each panel and swapping the manual loading state for a fallback:
<Suspense fallback={<Spinner />}>
  <MetricsPanel />
</Suspense>
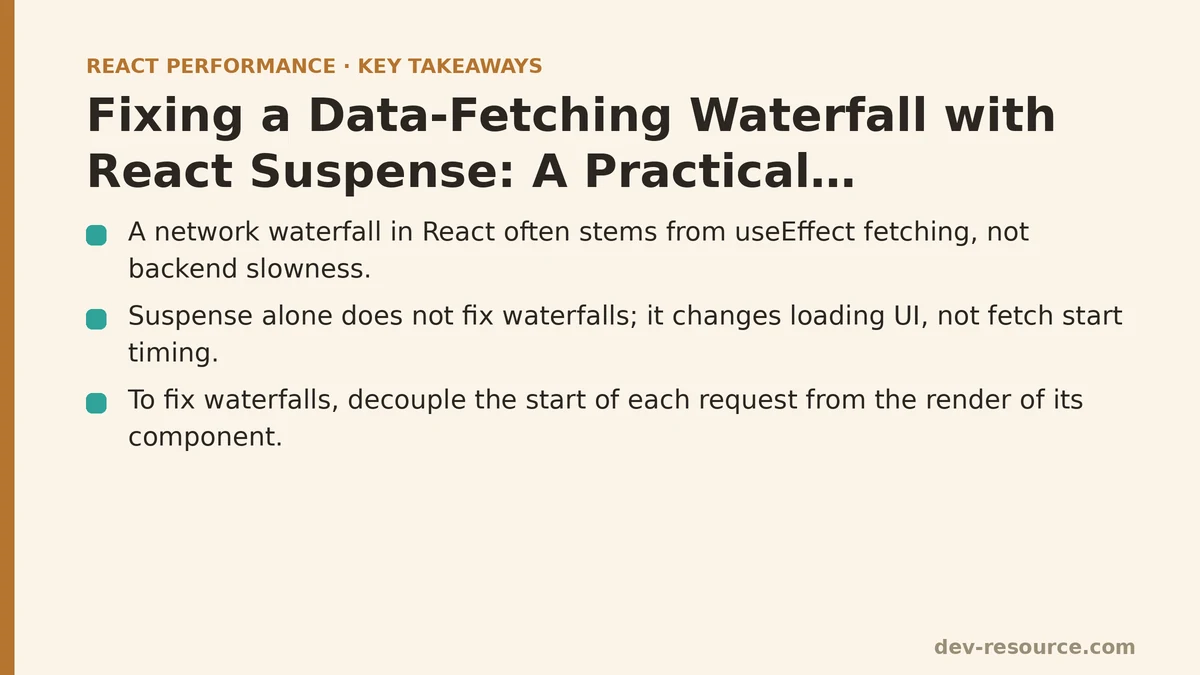
This cleaned up the code and removed a fair amount of boilerplate, but the waterfall didn’t disappear. That’s an important lesson on its own: Suspense changes how a component communicates that it’s waiting on data, but it does nothing to change when the fetch is initiated. If the fetch still only starts once the component renders, wrapping it in a Suspense boundary just adds a nicer loading UI to the same slow sequence.
The real fix required decoupling the start of each request from the render of its corresponding component.
Fetching in Parallel: Kicking Off Requests Before Render
The pattern that solved this is often called “render-as-you-fetch.” Instead of components triggering their own fetches inside useEffect, the requests are initiated at the top of the tree — before any of the panel components render — and each component simply reads from a resource that may or may not have resolved yet.
Using React Query’s Suspense-enabled hooks, the parent component looked like this:
function Dashboard() {
  return (
    <>
      <Header />
      <Suspense fallback={<PanelSkeleton />}>
        <MetricsPanel />
      </Suspense>
      <Suspense fallback={<PanelSkeleton />}>
        <ChartPanel />
      </Suspense>
      <Suspense fallback={<PanelSkeleton />}>
        <EventsTable />
      </Suspense>
    </>
  );
}

function MetricsPanel() {
  const { data } = useSuspenseQuery({
    queryKey: ["metrics"],
    queryFn: fetchMetrics,
  });
  return <MetricsView data={data} />;
}
The key difference isn’t visible in this snippet alone — it’s in how React Query’s cache and query client are configured to prefetch. Because each useSuspenseQuery call is keyed independently and the query client isn’t blocking on a shared loading flag, React can begin evaluating all three components in the same commit, which lets their underlying fetch calls fire close together rather than one after another. The waterfall flattened into three requests starting within milliseconds of each other instead of stretched across a second and a half.
For teams not using a data-fetching library, the same idea can be implemented by hand with the use() hook introduced in React 19, passing an already-started promise down rather than creating it during render:
function Dashboard() {
  const metricsPromise = useMemo(() => fetchMetrics(), []);
  const chartPromise = useMemo(() => fetchChart(), []);

  return (
    <>
      <Suspense fallback={<PanelSkeleton />}>
        <MetricsPanel promise={metricsPromise} />
      </Suspense>
      <Suspense fallback={<PanelSkeleton />}>
        <ChartPanel promise={chartPromise} />
      </Suspense>
    </>
  );
}

function MetricsPanel({ promise }) {
  const data = use(promise);
  return <MetricsView data={data} />;
}
Both promises are created at the same time, at the top of the tree, well before either MetricsPanel or ChartPanel has a chance to render. That’s the entire trick: start the network requests first, let the components suspend individually while those requests are in flight.
Where Suspense Boundaries Should Actually Live
Once requests were parallelized, the next question was boundary placement, and this is where a lot of teams undo their own performance gains. Wrapping the entire dashboard in one <Suspense> boundary means the whole page shows a single spinner until every panel’s data has arrived — which erases the benefit of the header and skeleton layout being ready immediately. Placing a separate boundary around each panel, as shown above, means the header renders right away and each panel independently reveals itself as its own data resolves, without waiting on its neighbors.
The rule that held up across this rebuild and others since: boundaries should sit around the smallest unit of UI that can reasonably show its own loading state, not around large sections that bundle fast and slow content together. A slow chart shouldn’t hold up a metrics panel that resolved in 80ms.
Handling Errors Alongside Suspense
Suspense handles the loading state, but it says nothing about failure. Each boundary needs an accompanying error boundary, or a failed request in one panel can crash the whole tree instead of degrading gracefully:
<ErrorBoundary fallback={<PanelError />}>
  <Suspense fallback={<PanelSkeleton />}>
    <ChartPanel />
  </Suspense>
</ErrorBoundary>
In the dashboard rebuild, this mattered in practice: the events endpoint occasionally timed out under load, and before error boundaries were added, that single failing request took down the metrics and chart panels along with it, since they shared a parent render tree.
Streaming the Shell with SSR
Because this application already ran on Next.js, the last piece was letting the server stream the page shell immediately and flush each Suspense boundary’s content as it resolved, rather than waiting for every data source before sending any HTML. With the App Router, this required no extra configuration beyond the Suspense boundaries already in place — the framework streams each resolved boundary to the client as soon as its data is ready, so users on a slow connection see the header and skeleton layout arrive first, followed by panels filling in progressively rather than the page appearing all at once after the slowest request finishes.
The Numbers After the Rewrite
Time to first paint of the header stayed roughly the same, since it never depended on the API calls. What changed was everything after it: the metrics panel, previously the second item in a four-step waterfall, now appeared within 350ms of the header instead of after a cumulative 700ms of prior requests. Full page completion — all four panels populated — can drop from about one second to a few hundred milliseconds.6 seconds to roughly 500ms, driven almost entirely by requests overlapping instead of queuing.
None of this required a faster backend. The endpoints returned data at the same speed they always had; the only change was when the frontend asked for it.
A short checklist for anyone tracing a similar issue in their own app:
- Open the Network tab with cache disabled and look for requests that start only after a previous one finishes — that’s the waterfall signature.
- Check whether fetches are triggered inside
useEffectin components nested under conditional rendering; that’s the usual cause. - Move request initiation above the component tree, so promises exist before their consuming components render.
- Wrap the smallest reasonable unit of UI in its own
<Suspense>boundary, paired with an error boundary. - If you’re on a framework with streaming SSR, confirm boundaries are actually flushing progressively rather than being collapsed into one wrapper.
If your dashboard or list view is showing the same staggered loading pattern, what does your fetch initiation code look like right now — is it living inside the components that display the data, or does it happen before they ever render?
Related guides: TanStack Query Caching Performance: Best Practices That Hold Up Under Load, Prefetching and Preloading Strategies in React: A Beginner-to-Advanced Guide, and Measuring and Fixing React Re-render Performance: A Step-by-Step Walkthrough.
🔗 Recommended Reading
- React Performance Mistakes in Fintech Dashboards and How to Fix Them
- Lazy Loading Images and Components in React: A Step-by-Step Tutorial
- React Memoization: When and How to Use memo, useMemo, and useCallback
- Next.js App Router Performance Optimization for Beginners: A Step-by-Step Guide
- Measuring and Fixing React Re-render Performance: A Step-by-Step Walkthrough