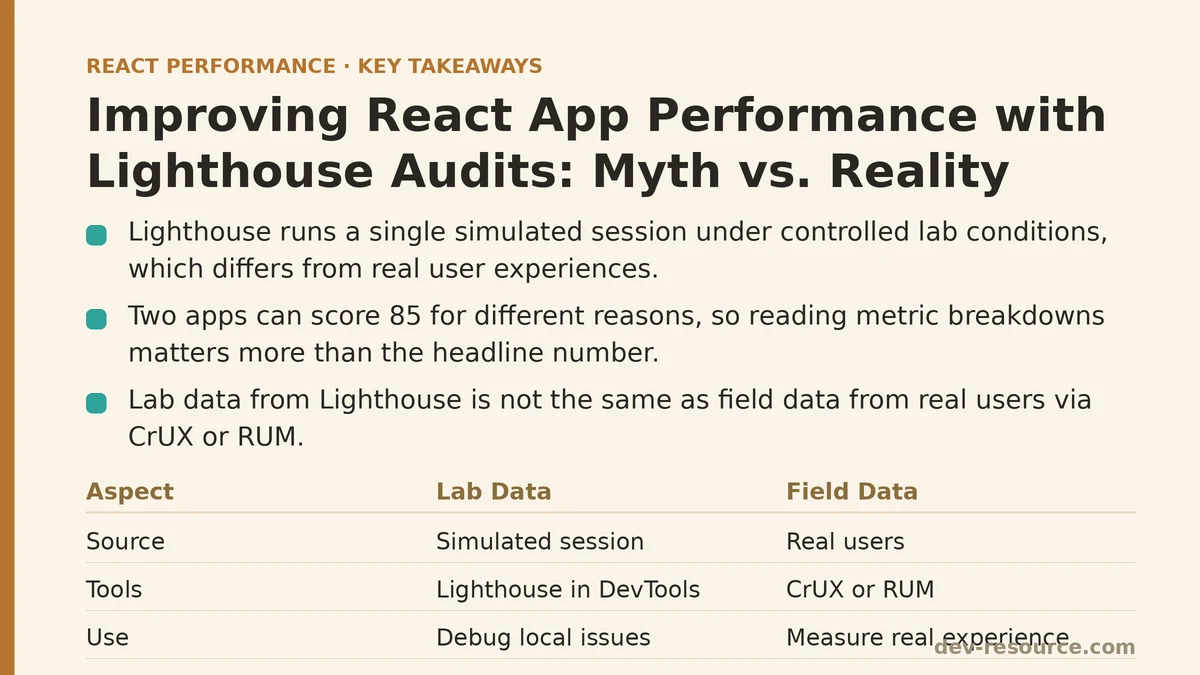
A React app can score 100 on Lighthouse and still feel sluggish to a real user on a real phone with a real network connection. That’s not a hypothetical edge case — it’s a predictable consequence of how the tool measures performance versus how performance is experienced. Lighthouse runs a single simulated session under controlled lab conditions. Users don’t. Understanding that gap is what separates developers who chase a number from developers who fix the underlying problem.
This post breaks down the common misconceptions about Lighthouse audits by comparing how a beginner typically approaches them against how a more experienced engineer reads the same report. The tool hasn’t changed between the two approaches — the interpretation has.
Myth: The Score Is the Goal
The most common beginner instinct is treating the Lighthouse performance number, 0 to 100, as the finish line. Run the audit, see a 62, make some change, run it again, see a 78, feel good about the progress. This isn’t wrong exactly, but it’s incomplete in a way that can quietly mislead a team for months.
Beginner approach: Optimize until the number goes up. Stop when it crosses 90.
Advanced approach: Treat the score as a weighted composite of individual metrics — Largest Contentful Paint, Total Blocking Time, Cumulative Layout Shift, Speed Index, and First Contentful Paint — each with its own weighting in the overall calculation. A score improvement driven entirely by a CLS fix says nothing about whether the app’s actual load time got faster. Reading the metric breakdown underneath the headline number matters more than the number itself.
The reality is that two apps can both score 85 for completely different reasons — one because it loads fast but shifts layout slightly, another because it’s stable but slow to paint. Treating those as equivalent problems leads to fixing the wrong thing.
Myth: One Lighthouse Run Tells You Everything
Lighthouse, run once from DevTools, produces a single measurement from a single simulated pass. Network conditions, CPU throttling, and even background system load on the machine running the audit can shift results run to run.
Beginner approach: Run the audit once, take the score at face value, ship the fix, move on.
Advanced approach: Run the audit multiple times and look at the median result, not the first number that appears. A React app with client-side data fetching can show meaningfully different Time to Interactive numbers between runs depending on how quickly an API responds during that particular simulation. Tools like Lighthouse CI exist specifically to smooth out this variance by running audits repeatedly and tracking trends over commits, rather than reacting to any single snapshot.
Variance isn’t a flaw in the tool — it’s a signal that a single run is a sample, not a certainty.
Myth: Lab Data and Field Data Measure the Same Thing
This is probably the single most consequential misunderstanding developers carry into a Lighthouse audit, and it’s worth stating directly: Lighthouse in DevTools produces lab data, generated from a simulated environment with fixed throttling settings on one machine. It is not the same thing as field data, which comes from real users on real devices, collected through the Chrome User Experience Report (CrUX) or a Real User Monitoring (RUM) tool installed in production.
Beginner approach: Assume a passing Lighthouse score in local development means users are having a fast experience in production.
Advanced approach: Cross-reference lab scores against field data from PageSpeed Insights or a RUM tool like web-vitals.js reporting back to an analytics endpoint. A React single-page app might score well in the lab, where the simulated network and CPU conditions are predictable, while field data reveals that a meaningful share of real users — on older Android devices, on slower mobile networks, in regions farther from the CDN edge — are experiencing LCP times well past the “good” threshold.
| Aspect | Lab Data (Lighthouse) | Field Data (CrUX / RUM) |
|---|---|---|
| Source | Simulated single run | Real users in production |
| Network conditions | Fixed, simulated throttling | Whatever the user actually has |
| Device | The machine running the audit | The user’s actual device |
| Best for | Diagnosing why something is slow | Confirming whether it’s slow for real users |
| Risk if used alone | Misses real-world variance | Doesn’t explain root cause |
Neither data source replaces the other. Lab data is where you diagnose a specific bottleneck in a repeatable environment. Field data is where you confirm that fixing it moved the needle for the people who matter.
Myth: Fixing the Metric Fixes the Experience
Lighthouse tells you that Total Blocking Time is high. It does not, on its own, tell a beginner why, and chasing the metric directly can lead to changes that improve the report without improving anything a user would notice.
Beginner approach: See a high TBT warning, add React.lazy somewhere in the codebase, hope the number drops.
Advanced approach: Open the Performance panel in Chrome DevTools alongside the Lighthouse report and look at the actual JavaScript execution timeline during the loading window. In a React app, high TBT is frequently caused by a large third-party script blocking the main thread, an oversized initial bundle that hasn’t been code-split, or an expensive synchronous render happening before hydration completes. Each of those has a different fix — deferring the third party, route-based code splitting, breaking up a heavy component tree — and none of them are interchangeable just because they all show up under the same TBT number.
The distinction matters because a superficial fix can still move the metric in the short term while leaving the structural cause untouched, only for the regression to reappear once the codebase grows again.
Myth: Audits Are a One-Time Task
Running Lighthouse before a launch and treating the resulting report as a permanent record is common, and it’s a habit that tends to catch up with a team eventually. Bundles grow. New dependencies get added. A well-meaning contributor imports an entire icon library instead of a single icon. None of that shows up unless someone re-runs the audit.
Beginner approach: Audit once during QA, file the report, consider performance “handled.”
Advanced approach: Wire Lighthouse CI or a similar tool into the deployment pipeline so that performance budgets are checked on every pull request, with the build failing or flagging a warning if a metric regresses past a defined threshold. This turns performance from a milestone into a continuously enforced constraint, which is the only way it tends to survive contact with an actively developed codebase.
Bringing the Two Approaches Together
None of this means the beginner approach is worthless — running Lighthouse at all puts a team ahead of one that never measures anything. The advanced approach isn’t a replacement so much as a deeper reading of the exact same report: same tool, same categories, same numbers, but with an understanding of what those numbers can and can’t tell you on their own.
A useful discipline going forward: treat every Lighthouse score as the start of a question, not the end of one. A high TBT isn’t an instruction to add React.lazy somewhere — it’s a prompt to open the Performance panel and find out what’s actually blocking the main thread. A passing lab score isn’t confirmation that users are happy — it’s a reason to check field data before declaring victory.
What does your team currently do with a Lighthouse report once it’s generated — read the score and move on, or treat it as the starting point for a deeper trace? That answer probably says more about your app’s real-world performance than the score itself does. Related guides: Measuring Core Web Vitals in React Apps: Myth vs. Reality, Improving Largest Contentful Paint (LCP) in React Apps: A Beginner vs Advanced Guide, and Fixing INP in React: 5 Interaction Delays Ranked by Impact.
🔗 Recommended Reading
- React Performance Mistakes in Fintech Dashboards and How to Fix Them
- Lazy Loading Images and Components in React: A Step-by-Step Tutorial
- React Memoization: When and How to Use memo, useMemo, and useCallback
- Next.js App Router Performance Optimization for Beginners: A Step-by-Step Guide
- Measuring and Fixing React Re-render Performance: A Step-by-Step Walkthrough