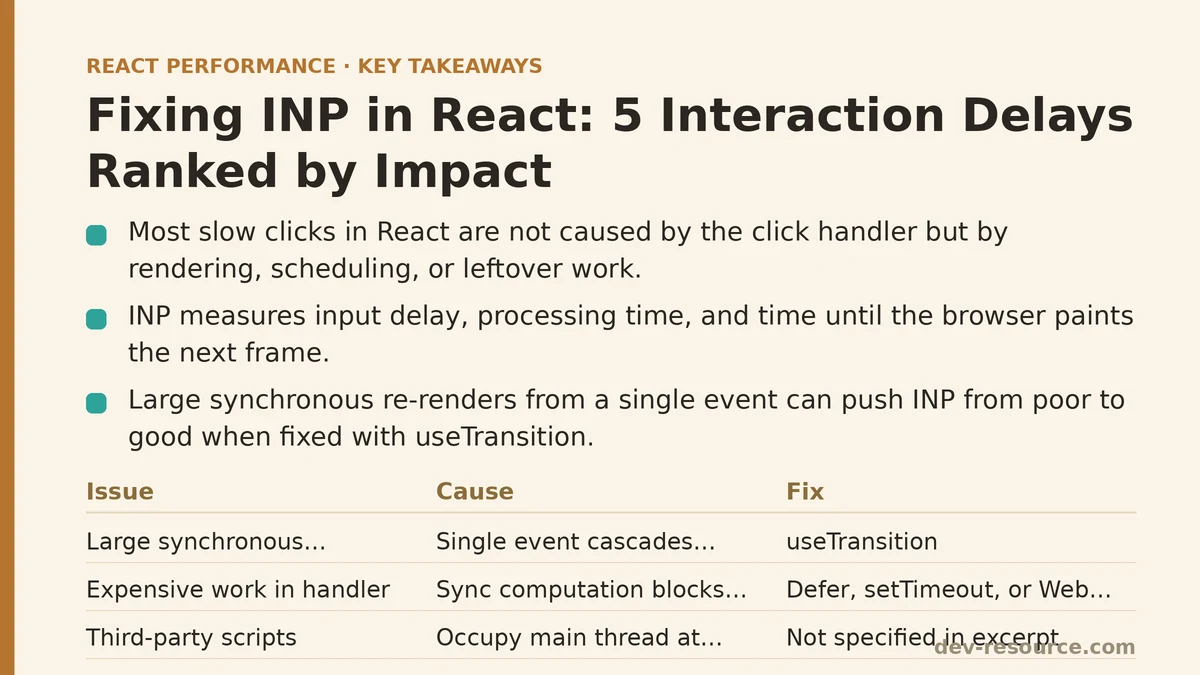
Most slow clicks in a React app have almost nothing to do with the click handler itself. That’s the part teams miss when they first start chasing a poor Interaction to Next Paint (INP) score: the function you attached to onClick might run in under a millisecond, and the interaction can still take 400ms to paint. The delay is hiding somewhere else in the pipeline — in rendering, in scheduling, in work left over from something that happened seconds earlier.
INP replaced First Input Delay as a Core Web Vital because it measures the full cost of an interaction, not just the moment input is first noticed. It captures input delay, processing time, and the time until the browser paints the next frame. A React app can look fast in every other metric and still fail INP because of how and when it decides to re-render.
Below are the five most common sources of INP trouble in React applications, ranked from the one that tends to cause the largest single-interaction penalty to the one that’s more of a slow accumulation. Each entry includes what causes it, how to spot it, and what actually fixes it.
1. Large Synchronous Re-renders Triggered by a Single Event
This is the one that produces the worst individual INP scores, and it’s also the easiest to reproduce in the Performance panel. A single click — say, opening a modal or applying a filter — triggers a state update that cascades through a large subtree, and React renders all of it synchronously before the browser gets a chance to paint anything.
The tell in the Performance panel is a long, unbroken “Task” bar immediately following the event, often 200ms or more, with no yielding to the browser in between. Nothing else can happen during that window: no scroll, no paint, no other event handling.
// Every keystroke re-renders a 5,000-row table synchronously
function SearchableTable({ items }) {
  const [query, setQuery] = useState('');
  const filtered = items.filter(i => i.name.includes(query));

  return (
    <>
      <input onChange={e => setQuery(e.target.value)} />
      <Table rows={filtered} />
    </>
  );
}
The fix that has the biggest effect here is useTransition, which lets React mark the expensive update as interruptible and non-blocking, so the input itself stays responsive while the table catches up a moment later.
function SearchableTable({ items }) {
  const [query, setQuery] = useState('');
  const [isPending, startTransition] = useTransition();
  const [filtered, setFiltered] = useState(items);

  function handleChange(e) {
    const value = e.target.value;
    setQuery(value);
    startTransition(() => {
      setFiltered(items.filter(i => i.name.includes(value)));
    });
  }

  return (
    <>
      <input value={query} onChange={handleChange} />
      <Table rows={filtered} dimmed={isPending} />
    </>
  );
}
Typical impact: Can single-handedly push INP from “poor” (over 500ms) to “good” (under 200ms) on the interaction it touches. This is usually the first thing worth checking.
2. Expensive Work Running Inside the Event Handler Itself
One rung down from the render problem is work that never even makes it to React — synchronous computation sitting directly inside the handler function. Sorting a large array, running a regex over a large string, formatting a big date range, or serializing an object for localStorage on every click all block the main thread before rendering starts.
This shows up in the Performance panel as time attributed directly to your handler function, before any “Render” or “Commit” phase begins. It’s easy to miss because it doesn’t look like a React problem at all — profiling by component won’t surface it, only profiling by interaction will.
function ExportButton({ rows }) {
  function handleClick() {
    const sorted = [...rows].sort(expensiveComparator); // blocks here
    downloadCsv(sorted);
  }
  return <button onClick={handleClick}>Export</button>;
}
The fix depends on whether the result needs to be ready instantly. If it can be deferred, move it into a transition or defer it with setTimeout(fn, 0) to let the browser paint first. If the work is unavoidable and heavy, moving it to a Web Worker keeps the main thread free entirely.
Typical impact: Often 50-150ms saved per interaction, and it disproportionately affects lower-end devices where the same computation takes three to four times longer than on a development machine.
3. Third-Party Scripts Occupying the Main Thread at the Wrong Moment
This one is often invisible in component-level profiling because the code responsible isn’t yours. Analytics tags, chat widgets, and ad scripts frequently run long tasks on a timer or on scroll, and if one of those tasks happens to be executing when a user clicks something, the click has to wait its turn in the task queue before your handler even starts.
The giveaway is a long task in the Performance panel with a stack trace pointing to a third-party domain, sitting adjacent to — but not caused by — your own interaction.
There’s no code fix inside your React components for this, which is precisely why it gets underestimated. The available levers are: loading non-critical third-party scripts with defer or after the page becomes interactive, auditing whether each script is worth its main-thread cost, and using requestIdleCallback for any of your own deferred work so it doesn’t compete for the same idle windows the third-party script needs.
Typical impact: Highly variable — from negligible to a dominant factor, depending entirely on which vendors are loaded. Worth checking before assuming the fault lies in your own component tree.
4. Layout Thrashing from Reading and Writing DOM Properties in Sequence
Reading a layout property like offsetHeight immediately after writing a style forces the browser to recalculate layout synchronously rather than batching it with the next paint. Inside an event handler that touches the DOM directly — often through a ref, bypassing React’s own batching — this can add up to several forced layout recalculations per interaction.
function Accordion({ isOpen }) {
  const ref = useRef();
  function toggle() {
    ref.current.style.height = isOpen ? '0px' : 'auto';
    const height = ref.current.offsetHeight; // forces synchronous layout
    ref.current.style.height = `${height}px`;
  }
  // ...
}
Each read-after-write pair like this is a forced synchronous layout, sometimes called “layout thrashing” when it happens repeatedly in a loop. The fix is to batch all reads before any writes, or avoid the manual DOM manipulation entirely in favor of CSS transitions driven by a class toggle.
Typical impact: Usually smaller than the first two entries on this list — often 10-40ms — but it’s cumulative, and it’s common to find several of these patterns stacked in the same interaction path, especially in animation-heavy components.
5. Unnecessary Context Updates Re-rendering Distant, Unrelated Components
This one rarely produces a dramatic single spike, but it’s the most common reason an entire app feels sluggish across many small interactions rather than failing on one big one. When a frequently-updating value lives in a React Context — a mouse position, a scroll offset, a theme toggle — every component consuming that context re-renders on every update, whether or not the interaction that triggered it has anything to do with them.
// Every click updates context, re-rendering every consumer, everywhere
const AppContext = createContext();

function AppProvider({ children }) {
  const [state, setState] = useState({ theme: 'light', sidebarOpen: false });
  return (
    <AppContext.Provider value={{ state, setState }}>
      {children}
    </AppContext.Provider>
  );
}
Splitting context into smaller, more targeted providers — one for theme, one for sidebarOpen — so a component only re-renders for the state it actually consumes, addresses most of this. Memoizing the context value itself with useMemo prevents a fresh object reference from invalidating every consumer even when the underlying data hasn’t changed.
Typical impact: Small per-interaction, in the 5-30ms range, but it degrades every interaction across the app rather than one isolated flow, which makes it a common reason INP looks “fine but not great” across the board rather than failing outright on any single page.
How These Five Compare
| Rank | Cause | Typical Single-Interaction Cost | Where to Look First |
|---|---|---|---|
| 1 | Large synchronous re-renders | 200ms+ | Performance panel, long Task bar after click |
| 2 | Expensive synchronous handler logic | 50-150ms | Time attributed to handler, before Render phase |
| 3 | Third-party scripts on main thread | Highly variable | Long tasks with third-party stack traces |
| 4 | Layout thrashing (read/write DOM) | 10-40ms, cumulative | Repeated forced reflow warnings |
| 5 | Unnecessary context re-renders | 5-30ms, app-wide | React DevTools Profiler, consumer count |
Where to Start If You Only Fix One Thing
If field data (from the Chrome UX Report or web-vitals library) shows a specific interaction with a poor INP score, start with the Performance panel and record that exact interaction. Whichever of the five patterns above shows up as the longest bar in the trace is the one worth fixing first — chasing the smaller, cumulative issues before addressing a 300ms synchronous render is a poor use of engineering time.
Which of these five is showing up in your own traces? If you’re stuck interpreting a specific Performance panel recording, describe what the trace looks like and I can help narrow down which pattern is responsible.
Related guides: Web Vitals Optimization for React SPAs: A Step-by-Step Guide, Lazy Loading Third-Party Scripts in React Apps: 5 Techniques Ranked by Impact, and The Top 5 Causes of Cumulative Layout Shift in React Apps (Ranked by Impact).
🔗 Recommended Reading
- React Render Props Performance: A Beginner Tutorial
- React Performance Mistakes in Fintech Dashboards and How to Fix Them
- Lazy Loading Images and Components in React: A Step-by-Step Tutorial
- React Memoization: When and How to Use memo, useMemo, and useCallback
- Next.js App Router Performance Optimization for Beginners: A Step-by-Step Guide