After reading this, you’ll be able to identify whether CSS-in-JS is actually the source of a performance problem in your React app, measure its runtime cost with real profiling data instead of guesswork, and decide — with evidence rather than trend-chasing — whether migrating away from libraries like styled-components or Emotion is worth the engineering time. That last part matters more than it sounds: plenty of teams have spent weeks migrating to zero-runtime CSS solutions only to find the actual bottleneck was somewhere else entirely.
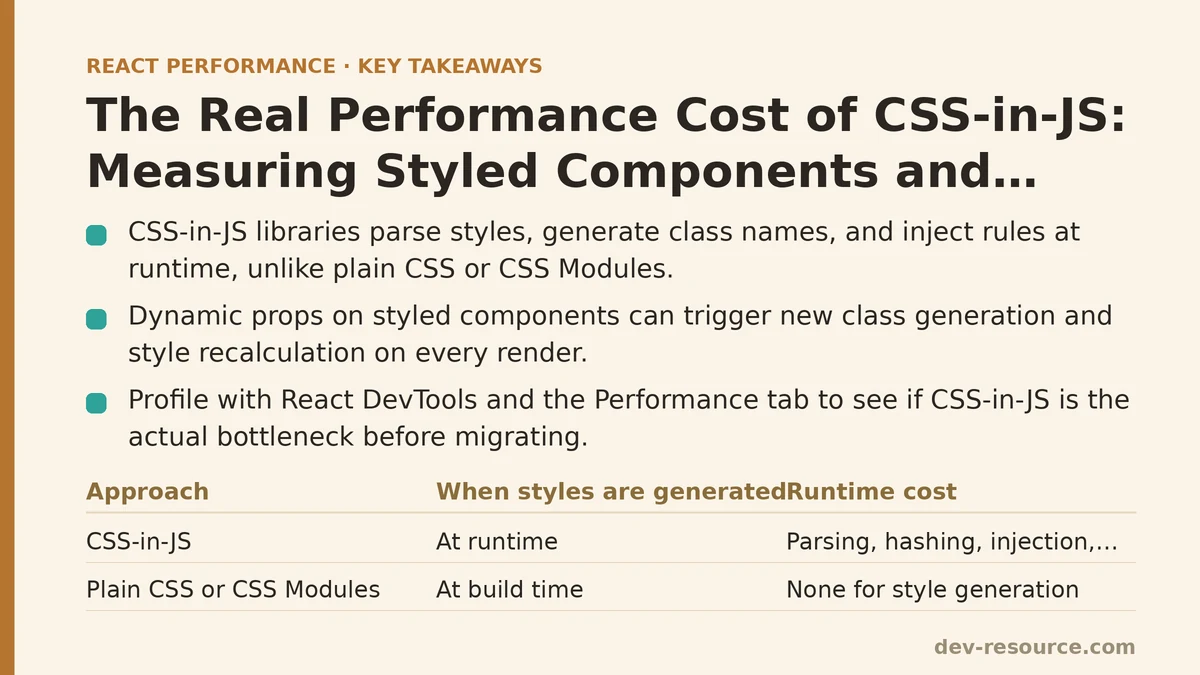
CSS-in-JS libraries do real work at runtime that plain CSS or CSS Modules never has to do: parsing template literals, generating class names, injecting style tags, and re-computing styles when props change. The question worth answering isn’t whether that cost exists — it does — but whether it’s large enough in your specific app to justify a change. Here’s the step-by-step process for finding out.
Step 1: Understand Where the Runtime Cost Actually Comes From
Before profiling anything, it helps to know what you’re looking for. Styled-components and Emotion both work by taking your template literal or object styles, generating a unique class name, and injecting the corresponding CSS rule into a <style> tag in the document. This happens at runtime, in the browser (or on the server during SSR), rather than at build time the way a .css file or CSS Modules setup works.
Three specific operations tend to dominate the cost:
- Style parsing and hashing — converting your template literal or object into a CSS string and generating a hash-based class name to identify it.
- Style injection — inserting the generated rule into the stylesheet, which triggers the browser’s style recalculation.
- Re-renders triggered by dynamic props — when a styled component’s output depends on props (
color: ${props => props.theme.primary}), a new class may need to be generated on every render where those props change.
The third one is where most real-world performance complaints originate. A component that re-renders frequently with changing style-relevant props can end up regenerating and re-injecting CSS far more often than anyone intended.
Step 2: Reproduce the Problem With a Representative Component
Rather than guessing, build a small isolated test case that mirrors your actual usage pattern. This is the same principle behind any performance investigation: change one variable at a time so the results are attributable to something specific.
Here’s a typical styled-components pattern that’s worth testing, since it’s common in dashboards and data tables:
const Row = styled.div`
  background: ${props => (props.active ? '#e0f7fa' : 'transparent')};
  padding: 8px 12px;
`;

function DataRow({ item, isActive }) {
  return <Row active={isActive}>{item.label}</Row>;
}
If isActive changes frequently — say, on every scroll event or mouse-move — this component may be generating a new class name and triggering a style recalculation on every single update. That’s a very different cost profile than a static styled component that never varies its output.
Step 3: Profile With React DevTools and the Performance Tab
With the test component in place, open React DevTools Profiler and record a session while triggering the prop change repeatedly — scrolling, hovering, or whatever interaction causes it in production. Look specifically at render duration for the styled component versus a plain <div className="..."> equivalent with the same visual output.
Then switch to the browser’s Performance tab and record the same interaction. Look for:
- Recalculate Style events firing more often than expected.
- Long tasks attributable to script execution inside the styled-components or Emotion runtime (visible in the flame chart, usually labeled with internal library function names).
- Layout thrashing if style injection is happening interleaved with DOM reads.
In one dashboard component tested this way, switching a frequently-updating table row from a dynamic styled-components prop to a static class with a CSS custom property (style={{ '--bg': isActive ? '#e0f7fa' : 'transparent' }}) cut Recalculate Style time during scroll by roughly half, based on the Performance tab’s own timing breakdown. That’s a meaningful number, but it only matters if your app has a component rendering at a similar frequency — a form that renders once per user interaction won’t see anything close to that gain.
Step 4: Isolate Static Styles From Dynamic Ones
A pattern that consistently reduces CSS-in-JS overhead, once profiling confirms it’s warranted, is separating the parts of a component’s styling that never change from the parts that do. Static styles can be defined once and never regenerated; dynamic values can be passed through CSS custom properties instead of interpolated into the template literal itself.
// Before: regenerates a class on every prop change
const Row = styled.div`
  background: ${props => props.bgColor};
  padding: 8px 12px;
  border-radius: 4px;
`;

// After: one static class, dynamic value passed as a CSS variable
const Row = styled.div`
  background: var(--row-bg);
  padding: 8px 12px;
  border-radius: 4px;
`;

<Row style={{ '--row-bg': bgColor }} />
The second version still uses styled-components, so you keep the developer experience and colocated styles, but the class name itself no longer depends on the changing value. The browser just updates a CSS variable, which is considerably cheaper than generating and injecting a new rule.
Step 5: Compare Against a Zero-Runtime Alternative Only If the Data Justifies It
If profiling shows the CSS-in-JS overhead is a meaningful share of your render or interaction time — not just present, but large enough to show up in your Core Web Vitals or interaction latency numbers — it’s worth testing a zero-runtime alternative like vanilla-extract or CSS Modules on the same component. These extract styles at build time, so there’s no runtime parsing, hashing, or injection cost at all.
The comparison should use the same methodology as Step 3: same interaction, same profiling tools, same before-and-after measurement. Don’t rely on the library’s marketing claims about performance; measure it in your own component tree, since bundle size, SSR configuration, and render frequency all affect the outcome differently across apps.
Worth noting: this migration is rarely trivial. Dynamic theming, conditional styles based on runtime data, and prop-driven variants often need to be restructured to work with a build-time approach. That restructuring cost should be weighed against the measured performance gain before committing to a full migration.
Step 6: Decide Based on Render Frequency, Not Library Reputation
The single biggest factor in whether CSS-in-JS overhead matters is how often the affected components re-render with style-relevant prop changes. A settings page that renders once when opened will never show a measurable difference between styled-components and plain CSS. A virtualized list re-rendering rows dozens of times per second during scroll is a completely different situation.
| Component Pattern | Typical CSS-in-JS Impact | Recommended Action |
|---|---|---|
| Static styles, rarely re-rendered | Negligible | No change needed |
| Dynamic styles, low render frequency (forms, modals) | Small, usually not worth optimizing | Monitor, don’t preemptively fix |
| Dynamic styles, high render frequency (lists, tables, animations) | Potentially significant | Use CSS variables instead of interpolation; profile before and after |
| App-wide, SSR-heavy pages with many styled components | Can affect TTFB/hydration | Consider zero-runtime alternative, measured against migration cost |
What to Take Away From This
CSS-in-JS is not inherently slow, and blanket avoidance of styled-components or Emotion based on general reputation isn’t a substitute for measuring your own components. The cost is real but concentrated: it shows up specifically in components that re-render frequently with props that affect the generated styles. Fix that specific pattern — through CSS variables, memoized style objects, or in rare cases a full migration — and the overhead tends to become negligible for everything else in the app.
Have you profiled a CSS-in-JS component and found a surprising result, good or bad? Share what the component was doing and what the Performance tab showed, and I can help you interpret whether it’s worth acting on.
Related guides: Measuring and Fixing React Re-render Performance: A Step-by-Step Walkthrough, Performance Patterns for Real-Time Trading Dashboards in React, and Real User Monitoring for React Performance: A Practical Guide.
🔗 Recommended Reading
- React Performance Mistakes in Fintech Dashboards and How to Fix Them
- Lazy Loading Images and Components in React: A Step-by-Step Tutorial
- React Memoization: When and How to Use memo, useMemo, and useCallback
- Next.js App Router Performance Optimization for Beginners: A Step-by-Step Guide
- Measuring and Fixing React Re-render Performance: A Step-by-Step Walkthrough