After reading this, you’ll be able to open your own package.json, identify which dependencies are contributing the most weight to your production bundle, and know exactly which fixes to apply first — swap, trim, or lazy-load — without guessing. The tools involved are already sitting in your build pipeline; most teams just never point them at the right question.
That question isn’t “is my code fast?” It’s “how much of what I’m shipping did I actually write?” For a lot of React apps, the honest answer is a small fraction. The rest is dependency code, and some meaningful portion of that is dead weight the app never needed in the first place.
Myth: A Dependency Only Costs What You Import
The intuitive assumption is that writing import { debounce } from 'lodash' only pulls in the debounce function. Bundlers are smart, the thinking goes, so they’ll figure out what’s unused and leave it out.
Reality: Import Style Determines Whether Tree-Shaking Even Applies
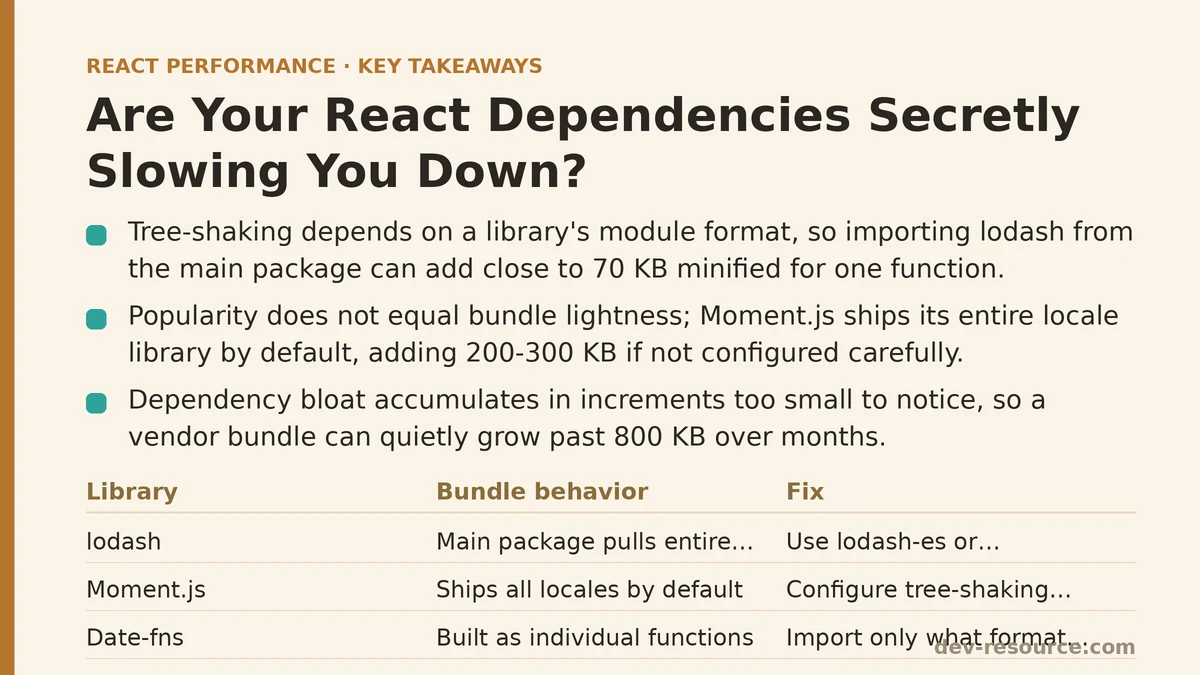
Tree-shaking depends on the module format and how the library is authored, not just on how you write the import statement. Pulling from the main lodash package (as opposed to lodash-es or per-method imports like lodash/debounce) frequently drags the entire library into the bundle, because the CommonJS build isn’t structured in a way bundlers can statically analyze and split apart.
// Pulls in far more than debounce — CommonJS, not tree-shakeable
import { debounce } from 'lodash';

// Tree-shakeable — imports only the debounce module
import debounce from 'lodash/debounce';
Run this through a bundle analyzer and the difference isn’t subtle. The first import can add close to 70 KB minified to a bundle for a single function. The second adds a few KB. Multiply that pattern across a handful of utility imports scattered through a codebase, and the “just one function” assumption stops holding up.
Myth: A Well-Maintained, Popular Package Is Automatically a Light One
Weekly download counts and GitHub stars get treated as a proxy for quality, and by extension, for performance. A library with millions of downloads must have been optimized by now — surely someone would have noticed if it were bloated.
Reality: Popularity Tracks Usefulness, Not Bundle Weight
Moment.js is the textbook example. It’s battle-tested, extensively documented, and used in an enormous number of production apps — and it also ships with its entire locale library bundled by default, which can add 200-300 KB to a build if the tree-shaking configuration isn’t set up carefully. Date-fns, by comparison, is built as individual functions from the start, so importing format pulls in only what format needs.
// moment: bundles far more than most apps use
import moment from 'moment';

// date-fns: modular by design, imports only what's called
import { format } from 'date-fns';
Neither library is “bad.” Moment.js does what it was built to do reliably. The mismatch happens when a library designed for a different set of tradeoffs gets dropped into a performance-sensitive app without anyone checking what that tradeoff costs in bundle size.
Myth: If Performance Were a Real Problem, You’d Notice It
There’s a comforting belief that dependency bloat announces itself — a laggy page, a visibly slow load, something a developer would catch during normal testing.
Reality: Bloat Accumulates in Increments Too Small to Notice Individually
A single 15 KB icon library addition doesn’t feel like a regression. Neither does a 20 KB form-validation helper, or a 30 KB analytics SDK, or a charting library pulled in for one dashboard widget. Each decision looks reasonable in isolation. None of them trip an alarm during code review. Eighteen months later, the vendor bundle has quietly grown past 800 KB, and nobody can point to the single commit that caused it — because there wasn’t one.
This is why manual code review is a poor tool for catching this class of problem. What’s needed is a measurement, taken regularly, that shows the trend rather than a single snapshot.
Myth: Dev Dependencies Never Reach Production Users
Testing libraries, linters, and local dev tooling live in devDependencies for a reason — they’re not meant to ship. It’s easy to assume that separation is airtight.
Reality: Misconfigured Builds and Accidental Imports Can Leak Dev Code In
The category a package sits in doesn’t stop a stray import from pulling it into a production bundle. A debugging utility imported at the top of a shared component, left in after the bug was fixed, ships to every user regardless of which package.json field lists the dependency. The build tooling has no opinion about intent — it only follows the import graph.
// This import ships to production no matter what package.json says,
// if this file is part of the app's bundle
import { logRenderInfo } from 'debug-utils';
Catching this requires actually looking at what’s in the built output, not trusting the dependency manifest to describe reality.
The Audit: Finding Out What’s Really in Your Bundle
Three tools cover most of what’s needed here, and none of them require changing the app’s code first.
source-map-explorer or webpack-bundle-analyzer generate a visual treemap of the production bundle, sized by how much space each module occupies after minification. Running this on a bundle that hasn’t been checked in a while is often the first moment a team sees which dependencies are dominating the payload — and it’s frequently not the ones anyone expected.
npx source-map-explorer build/static/js/*.js
Bundlephobia answers a narrower but faster question: before adding a new dependency, what will it cost? Searching a package name there returns minified and gzipped size, along with whether the package tree-shakes cleanly. This is worth checking before a package is added, not after it’s already spread through a dozen files.
Import Cost, an editor extension for VS Code, shows the size of each import inline, next to the line of code, updating as you type. For catching regressions during development rather than after a release, this is the fastest feedback loop of the three.
Fixing What the Audit Turns Up
Once the analyzer output identifies the heavy modules, the fix usually falls into one of three categories.
Replace. Swap a heavyweight library for a lighter, purpose-built alternative that covers the same use case. Moment.js to date-fns or day.js is the most common version of this; a full icon font to a handful of individually imported SVG icons is another.
Trim. Fix the import statement rather than replacing the library. Switching from import _ from 'lodash' to individual method imports, or from a full UI kit import to per-component imports, often recovers most of the savings without touching a dependency at all.
Defer. For code that isn’t needed on initial page load — a modal, a settings panel, a rarely-visited admin view — dynamic import() combined with React.lazy moves that weight out of the critical bundle and into a chunk that loads on demand.
import { lazy, Suspense } from 'react';

const AdminPanel = lazy(() => import('./AdminPanel'));

function App() {
  return (
    <Suspense fallback={<p>Loading...</p>}>
      <AdminPanel />
    </Suspense>
  );
}
None of these require a framework migration or a rewrite. They’re targeted changes, applied to whichever modules the analyzer flags as disproportionately large relative to what they provide.
What This Looked Like in Practice
Applying this audit to a mid-sized dashboard app turned up three offenders: a full lodash import used for two functions, moment.js with its full locale set, and an icon library imported wholesale for a dozen icons. Fixing all three dropped the main bundle from 1.4 MB to 780 KB — before any lazy-loading was applied.
| Dependency Issue | Before | After Fix |
|---|---|---|
Full lodash import |
~70 KB | ~4 KB (per-method imports) |
moment with all locales |
~290 KB | ~12 KB (switched to date-fns) |
| Full icon library import | ~140 KB | ~18 KB (individual icon imports) |
None of these changes touched application logic. They were import statements and one library swap, and the combined effect showed up immediately in both bundle size and Time to Interactive on the same throttled-connection test used before.
A Short Checklist Before Your Next Dependency Audit
- Run a bundle analyzer and note the three largest third-party modules by size.
- Check whether each one is imported wholesale or per-function.
- Search Bundlephobia for lighter alternatives to anything surprisingly large.
- Confirm nothing above-the-fold or on the critical path is being lazy-loaded by mistake.
- Repeat this on a schedule — quarterly, at minimum — rather than treating it as a one-time cleanup.
The dependencies you added for good reasons rarely become a problem on their own. It’s the ones added without a second look — the quick fix, the one-off utility, the “we’ll clean it up later” import — that tend to be sitting in the treemap, larger than expected, the next time someone finally checks. Related guides: Building a Performance-First React Component Library from Scratch, Diagnosing UI Freezes in React: Your Guide to Web Workers, and How to Analyze and Reduce Your React Bundle Size.
🔗 Recommended Reading
- React Performance Mistakes in Fintech Dashboards and How to Fix Them
- Lazy Loading Images and Components in React: A Step-by-Step Tutorial
- React Memoization: When and How to Use memo, useMemo, and useCallback
- Next.js App Router Performance Optimization for Beginners: A Step-by-Step Guide
- Measuring and Fixing React Re-render Performance: A Step-by-Step Walkthrough